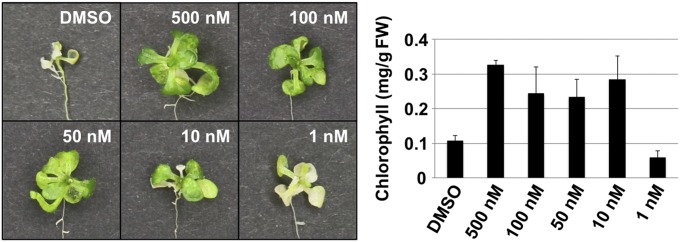
Fig. 6.
Dose–response test of the AtPep3/AT13 peptide affected in salinity stress tolerance. (Left) Representative images of plants from the AT13-5 dose–response test. (Right) Chlorophyll content per fresh weight (FW) in plants after each peptide/salt treatment. Plants were treated with different concentrations of AT13-5 peptides for 3 d (peptide pretreatment) before being treated with medium containing the different concentrations of the peptide plus 150 mM NaCl. The presented data represent the average of three biological replicates. DMSO treatment was used as a control.

