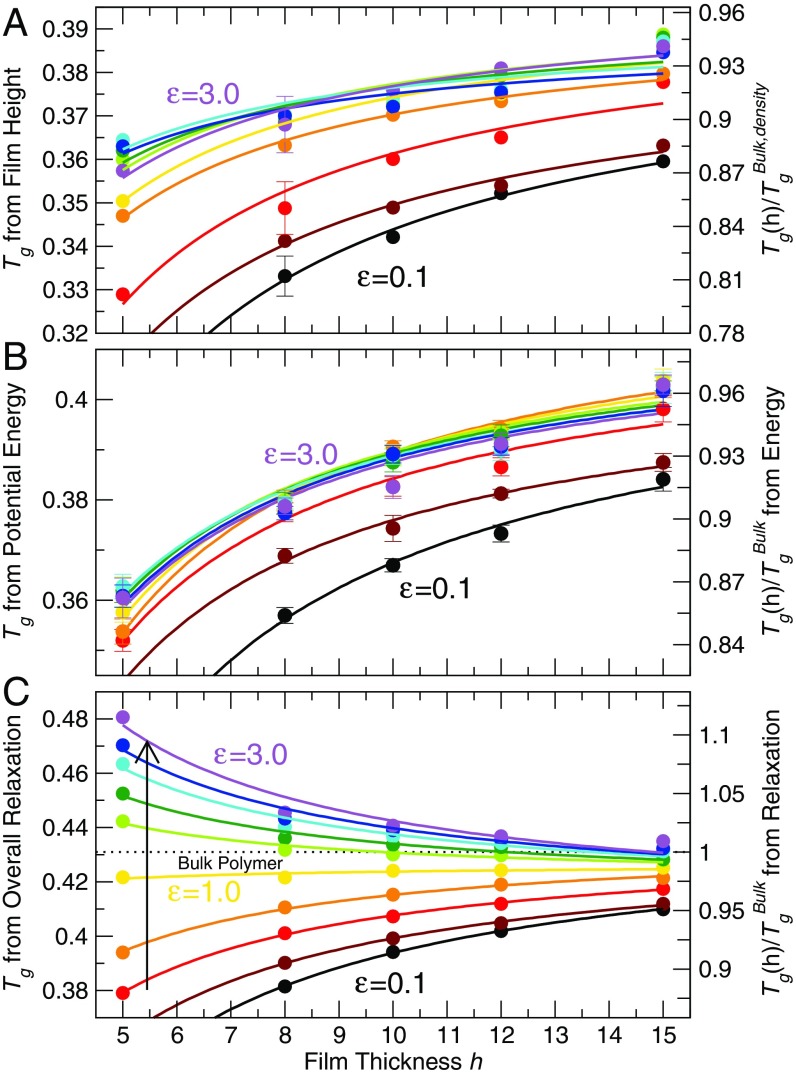
Fig. 1.
(A–C) The glass transition temperatures of thin polymer films, defined from the dependence of (A) film height and (B) potential energy, and (C) a fixed relaxation time [] plotted as a function of film thickness for polymer–substrate interaction strengths 0.1, 0.25, 0.5, 0.75, 1.0, 1.25, 1.5, 2.0, 2.5, and 3.0 (bottom to top). On the right side of the vertical axis, we normalize each definition of by the corresponding glass transition temperature of the bulk polymer . For A, we use defined by the dependence of density on heating, the nearest equivalent to film thickness. For both A and B, we average obtained from at least three independent runs and show the representative SE of the estimates. For extremely thin films , polymers do not adhere to the substrate for weak substrate interactions ( 0.1, 0.25), and thus we exclude values for those films. The lines are a guide for the eye and come from a fit to a model for the thickness dependence of (ref. 37 and SI Appendix, section IV).

