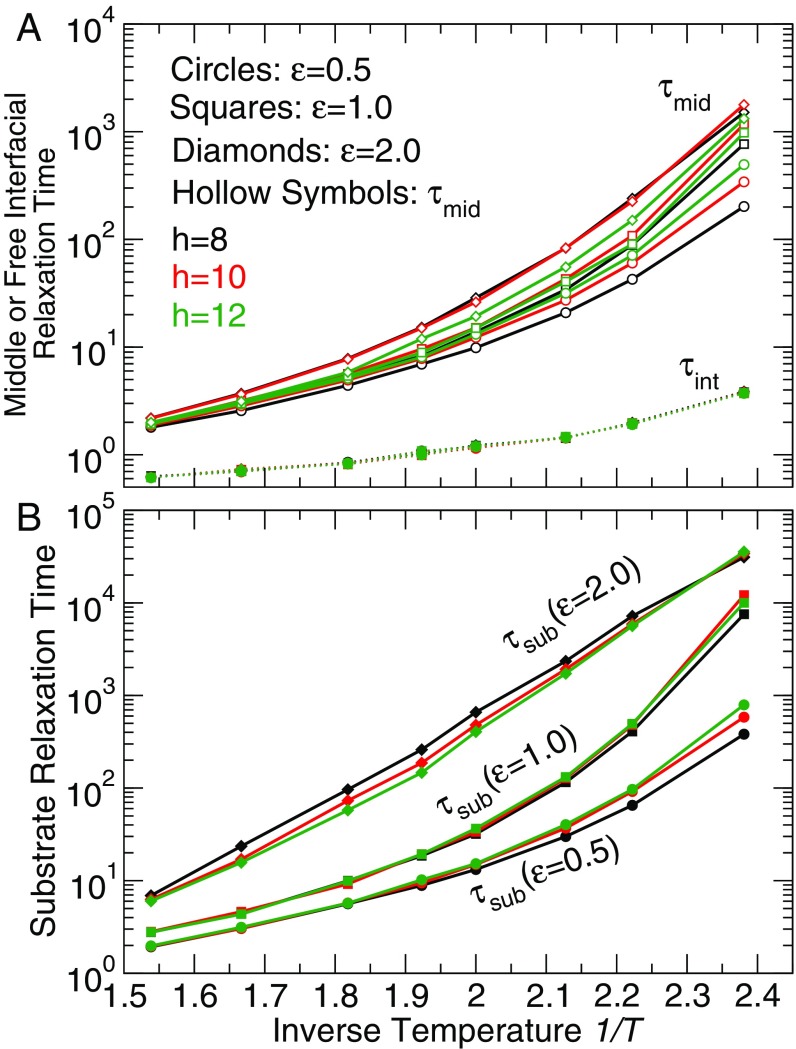
Fig. 4.
The average relaxation time of (A) film middle (open symbols), (B) substrate layer , and (A) free surface layer as a function of inverse temperature for representative film thickness (black), 10 (red), and 12 (green) and polymer–substrate interaction 0.5 (circles), 1.0 (squares), and 2.0 (diamonds). (solid symbols with dashed lines) for all of the and thickness is nearly identical at the same temperature; is nearly the same at high temperature and exhibits stronger dependence for thicker film; however, shows a significant dependence.

