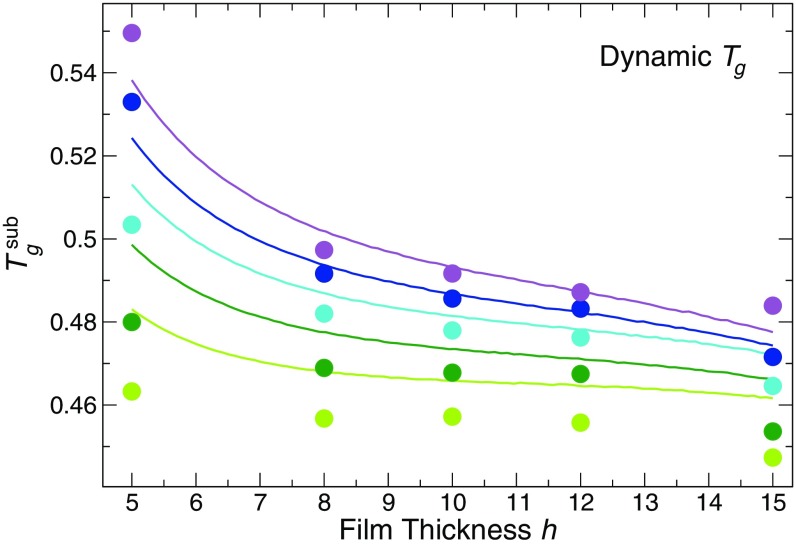
Fig. 6.
Comparison of the predicted dynamic substrate glass transition temperatures with values obtained from simulation. The solid circles are the values directly obtained from our data (same data as in Fig. 5A) with 1.25, 1.5, 2.0, 2.5, and 3.0. The solid curves are the values predicted from Eq. 4. The curves are obtained by first fitting the thickness dependence of the mean values from dynamic and thermodynamic methods using a Gibbs–Thomson-inspired model (see SI Appendix, section IV for a description).

