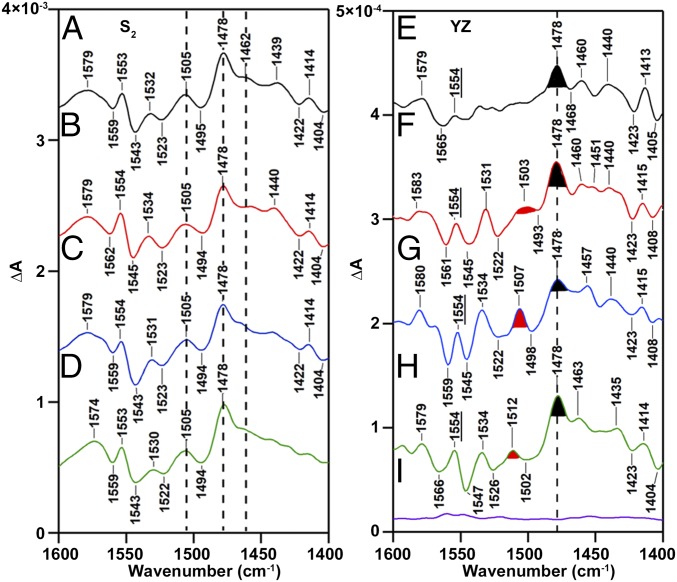
Fig. 3.
Spectra associated with the S1 to S2 transition (Left) and YZ·QA− recombination (Right). RIFT-IR spectra (1,600–1,400 cm−1) were acquired at 190 K and pH 6.0. In each panel, CD-PSII is black (A and E); Ca-PSII is red (B and F); Sr-PSII is blue (C and G), and Ba-PSII is green (D and H). (Left) Representing the S1-to-S2 transition, spectra are averages of 12 (A), 13 (B), 11 (C), and 14 (D). (Right) Representing YZ·QA− recombination, a baseline, purple (I), is generated from S2-minus-S2, and spectra are averages of 17 (E), 15 (F), 15 (G), 18 (H), and 12 (I) samples. Spectra were constructed as B1-minus-B30 (Fig. 2D). The filled and marked bands are discussed in the text.

