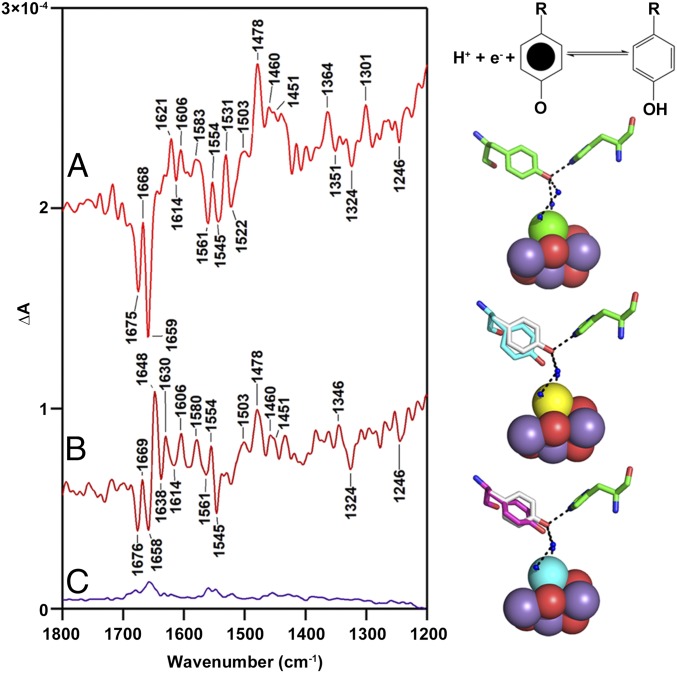
Fig. 5.
Time dependence of the YZ·QA− RIFT-IR signal (Left) and a conformational model (Right) showing divalent cation effects on the amide I region. (Left) RIFT-IR spectra acquired at 190 K, showing YZ·QA−-minus-YZQA spectra from Ca-PSII at two different times after the laser flash. The spectra are (A) red, B1-minus-B30, corresponding to 0 s minus 87 s, and (B) brown, B10-minus-B30, corresponding to 30 s minus 87 s), at pH 6.0. See method, Fig. 2. Spectra in A and B are averages derived from 15 samples. C is a baseline, generated from S2-minus-S2 (12 samples). (Right) Calcium-dependent, conformational selection and the YZ·QA− recombination reaction. Waters are shown as blue spheres (colors as Fig. 1). The conformer at the top is taken from PDB ID code 4UB6. The other conformers are speculative and were generated using the mutagenesis function.

