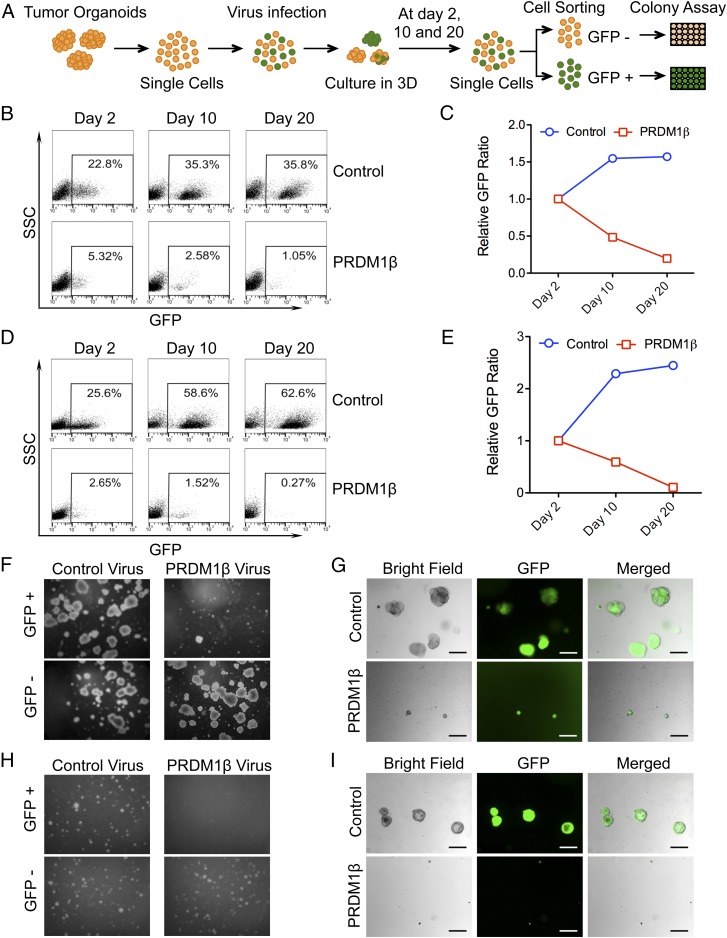
Fig. 5.
PRDM1 inhibits colon tumor organoid clonal survival. (A) Schematic of the tumor organoid-forming assay. (B) Flow cytometry scatter plots showing the percentage of GFP+ cells in P07132016 tumor organoids at the different time points indicated. (C) Percentages of GFP+ cells were normalized to day 2 starting material. Relative GFP ratios from patient P07132016 are shown. (D) Flow cytometry scatter plots showing the percentage of GFP+ cells in P10152015 tumor organoids at the indicated time points. (E) Percentages of GFP+ cells were normalized to day 2 starting material. The relative GFP ratios from patient P10152015 are shown. (F) Representative images of the organoid-forming assay from patient P07132016 colon tumor organoids. GFP+ cells and GFP− cells from control or PRDM1-infected organoids were plated in Matrigel at a density of 500 cells per well in 24-well plates and were cultured for 14 d. Representative images are shown. (Magnification, 40×.) (G) Patient P07132016 organoids from control and PRDM1-infected cells were GPF+. Organoids infected with control virus were larger and greater in number than those infected with PRDM1β virus. (H) Representative images of the organoid-forming assay from patient P10152015 colon tumor organoids. GFP+ cells and GFP− cells from control or PRDM1-infected organoids were plated in Matrigel at a density of 500 cells per well in 24-well plates and were cultured for 3–5 wk. Representative images are shown. (Magnification, 40×.) (I) Organoids derived from patient P10152016 infected with lentivirus containing PRDM1β and control virus are GPF+. Organoids infected with control virus are larger and greater in number than those infected with PRDM1β virus. (Scale bars in G and I: 200 μm.)

