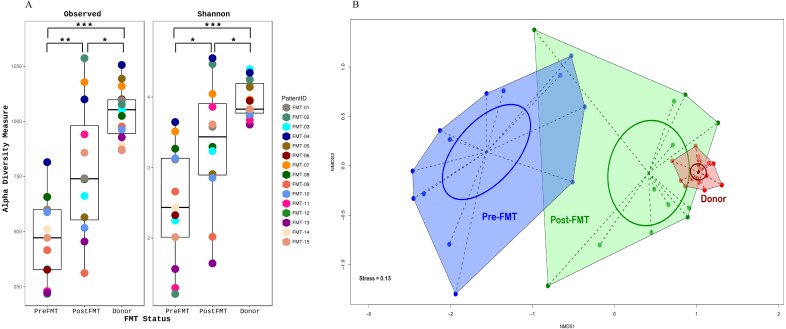
Figure 2. Alpha and beta diversity of samples.
(A) Alpha diversity is a measure of species richness within a sample which is quantitatively expressed here as a box-plot of the number of observed unique taxa/OTU’s and Shannon diversity index on y-axis. Individual samples are colored according to their patient ID grouped by their FMT status on the x-axis. (B) Beta diversity is a measure of taxonomic composition diversity between sample that is represented as Non-metric multidimensional scaling (NMDS) ordination of samples based on Bray-Curtis distance matrix. The color and shape of samples are according to their FMT status identity (RED, donor; BLUE, pre-FMT or GREEN, post-FMT), with samples belonging to the same FMT group connected to form polygons. The more similar the groups are to each other (donor and post-FMT), the closer their polygon clusters are going to be on the ordination plot and vice versa (pre-FMT compared to both donor and post-FMT). The dotted lines connect individual samples to the group centroid while the ellipse gives an estimate of standard deviation of the scores. (FMT, Fecal Microbiota Transplantation).

