
Fig. 1.
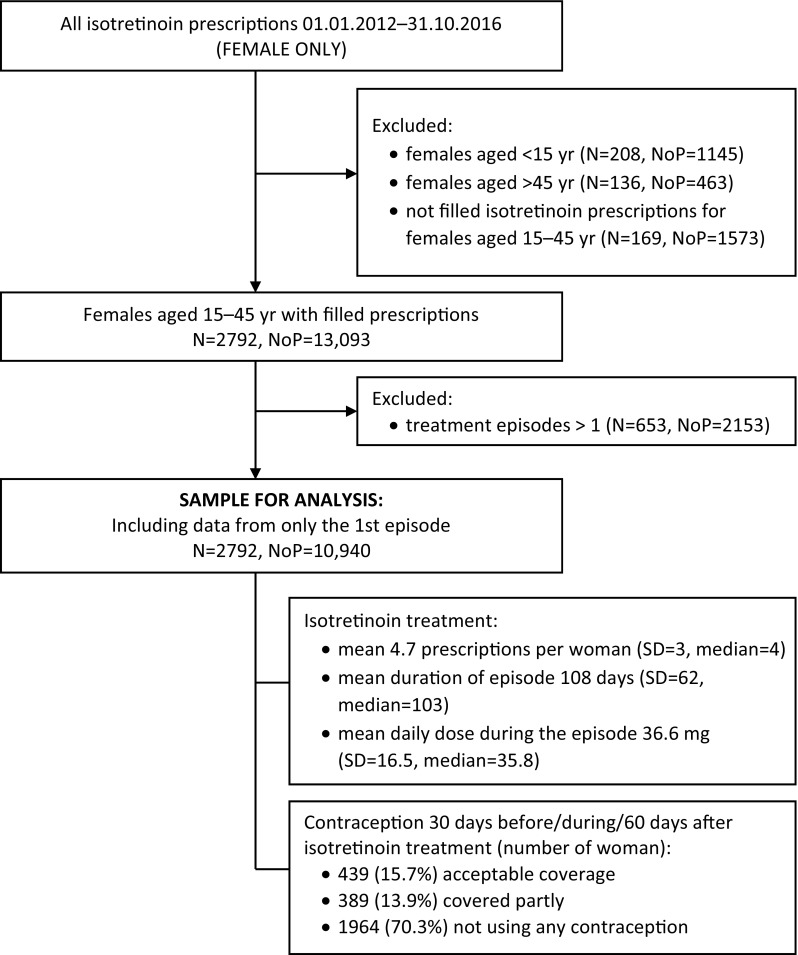
Flow chart showing the data selection process for the analysis of the compliance with pregnancy prevention recommendations for isotretinoin in Estonia (2012–2016). N number of individuals, NoP number of prescriptions
Official websites use .gov
A
.gov website belongs to an official
government organization in the United States.
Secure .gov websites use HTTPS
A lock (
) or https:// means you've safely
connected to the .gov website. Share sensitive
information only on official, secure websites.
Flow chart showing the data selection process for the analysis of the compliance with pregnancy prevention recommendations for isotretinoin in Estonia (2012–2016). N number of individuals, NoP number of prescriptions