Fig. 2.
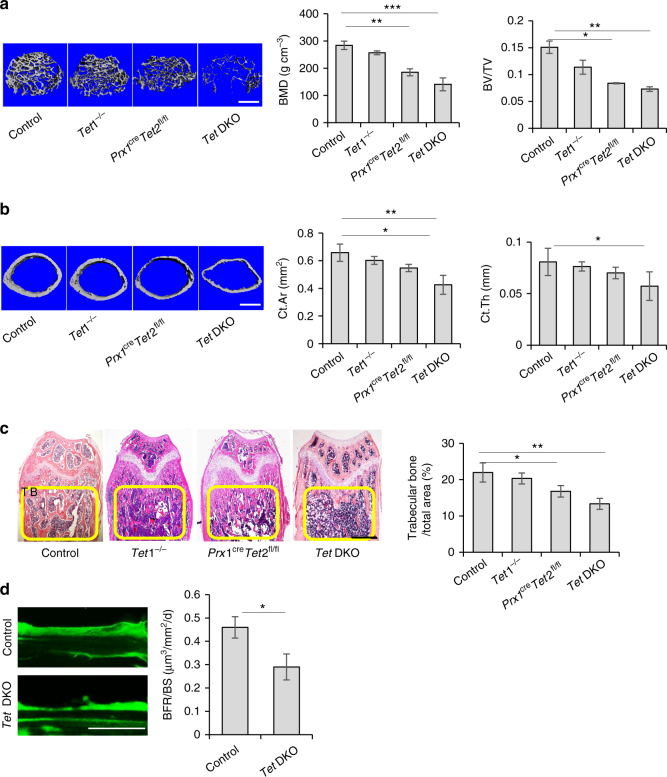
Tet DKO mice show an osteopenia phenotype. a Bone volume/tissue volume (BV/TV) of trabecular bone area in the femurs of control, Tet1−/−, Prx1creTet2fl/fl, and Tet DKO mice were analyzed by micro-CT. b The cortical bone area (Ct.Ar) and cortical thickness (Ct.Th) in the femur of control, Tet1−/−, Prx1creTet2fl/fl, and Tet DKO mice were assessed by micro-CT. c H&E staining showed the trabecular bone volume (yellow-circled area) in the distal femurs of control, Tet1−/−, Prx1creTet2fl/fl, and Tet DKO mice. d Calcein double labeling assay showed the bone formation rate in the metaphyseal trabecular bone of control and Tet DKO mice. The 8–10-week-old Tet1−/−Prx1creTet2fl/fl mice were used as Tet DKO mice in these experiments, and their littermates whose genetic status was Prx1cre were used as controls. *p < 0.05, **p < 0.01, ***p < 0.001 (mean ± SD). Scale bars, 400 μm (a, b), 1 mm (c), and 25 μm (d). Results are from three independent experiments. p values were calculated using one-way ANOVA (a-c) and two-tailed Student's t test (d)

