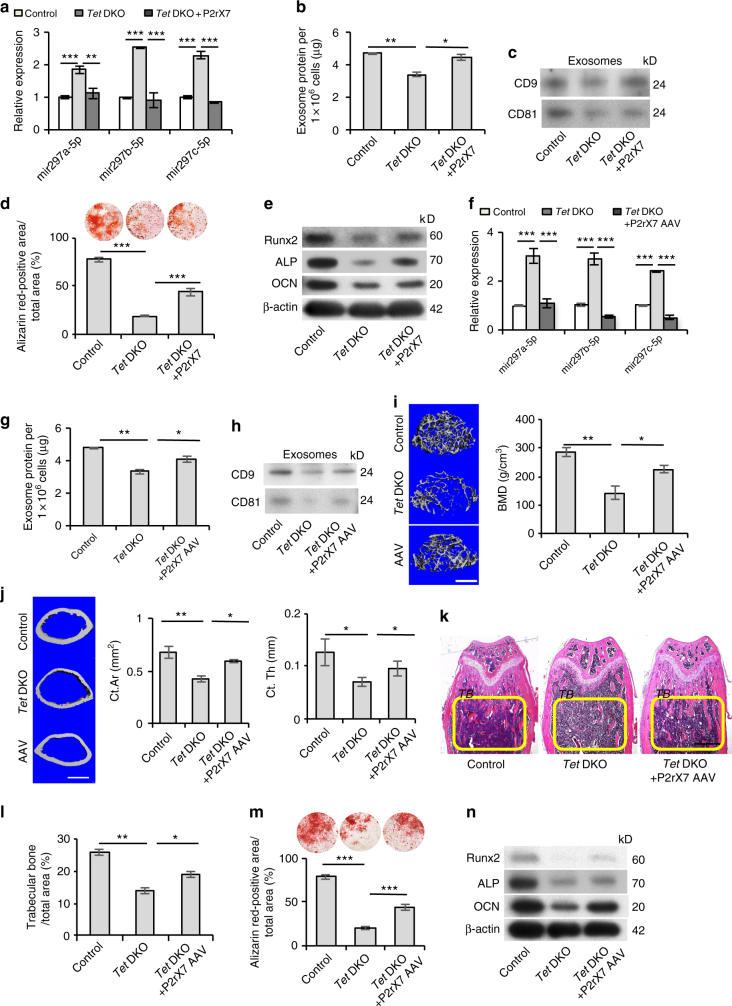
Fig. 6.
P2rX7 activation rescues impaired Tet DKO BMMSCs and osteopenia phenotype in Tet DKO mice. a The levels of miR-297a-5p, miR-297b-5p, and miR-297c-5p in control, Tet DKO BMMSCs, and P2rX7 CRISPR activation plasmid-treated Tet DKO BMMSCs. b Bradford assay showed the exosome secretion in control, Tet DKO BMMSCs, and P2rX7 CRISPR activation plasmid-treated Tet DKO BMMSCs. c Western blotting showed the expression of CD9 and CD81 in control, Tet DKO BMMSCs, and P2rX7 CRISPR activation plasmid-treated Tet DKO BMMSCs. d, e Mineralized nodule formation and the expression of Runx2, ALP, and OCN in control, Tet DKO BMMSCs, and P2rX7 CRISPR activation plasmid-treated Tet DKO BMMSCs, as assessed by alizarin red staining (d) and western blotting (e). f The expression of miR-297a-5p, miR-297b-5p, and miR-297c-5p in control, Tet DKO BMMSCs, and adeno-associated P2rX7 overexpression virus (P2rX7 AAV)-treated Tet DKO BMMSCs, as assessed by qPCR. g Bradford assay showed the exosome secretion level in control, Tet DKO BMMSCs, and P2rX7 AAV-treated BMMSCs. h Western blotting showed the expression of CD9 and CD81 in exosomes derived from control, Tet DKO BMMSCs, and P2rX7 AAV-treated BMMSCs. i Bone mineral density (BMD) of trabecular bone (TB) area in distal femurs of control, Tet DKO, and P2rX7 AAV-treated-mice, as assessed by micro-CT. j The cortical bone area (Ct.Ar) and cortical thickness (Ct.Th) of the femurs of control, Tet DKO, and P2rX7 AAV-treated-mice analyzed by micro-CT. k, l H&E staining showed the TB volume (yellow-circled area) of control, Tet DKO, and P2rX7 AAV-treated-mice. m The capacity of BMMSCs isolated from control, Tet DKO, and P2rX7 AAV-treated-mice to form mineralized nodules as assessed by alizarin red staining. n Western blotting analysis showed the expression levels of the osteogenic markers Runx2, ALP, and OCN in control, Tet DKO, and P2rX7 AAV-treated Tet DKO BMMSCs. The 8–10-week-old Tet1−/−Prx1creTet2fl/fl mice were used as Tet DKO mice in our experiments, and their littermates whose genetic status was Prx1cre were used as controls. *p < 0.05, **p < 0.01, ***p < 0.001 (mean ± SD). Scale bars, 400 μm (i, j), 1 mm (k). Results are from three independent experiments. p values were calculated using one-way ANOVA

