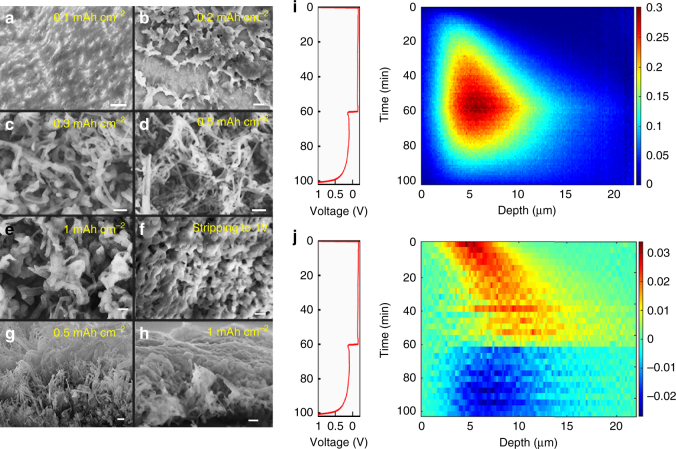
Fig. 2.
Li density and Li-metal-plating/stripping activity by operando NDP compared with ex situ SEM. a-h SEM measurement showing the 1 mA cm–2 Li-plated metal morphology at a 0.1, b 0.2, c 0.3, d 0.5, and e 1 mAh cm−2 and f after stripping. g, h Cross sections are shown for 0.5 and 1 mAh cm−2. The scale bar in a–b is 5 μm and in c–h it is 1 μm. i Displays the Li density vs. time from operando NDP during the first plating and stripping cycle at 1 mAh cm–2 and j the Li-plating and stripping activity, which is derived from the change in Li density upon each time step in i. In i and j the depth is measured starting from the interface of the Cu current collector with the electrolyte/SEI/Li-metal

