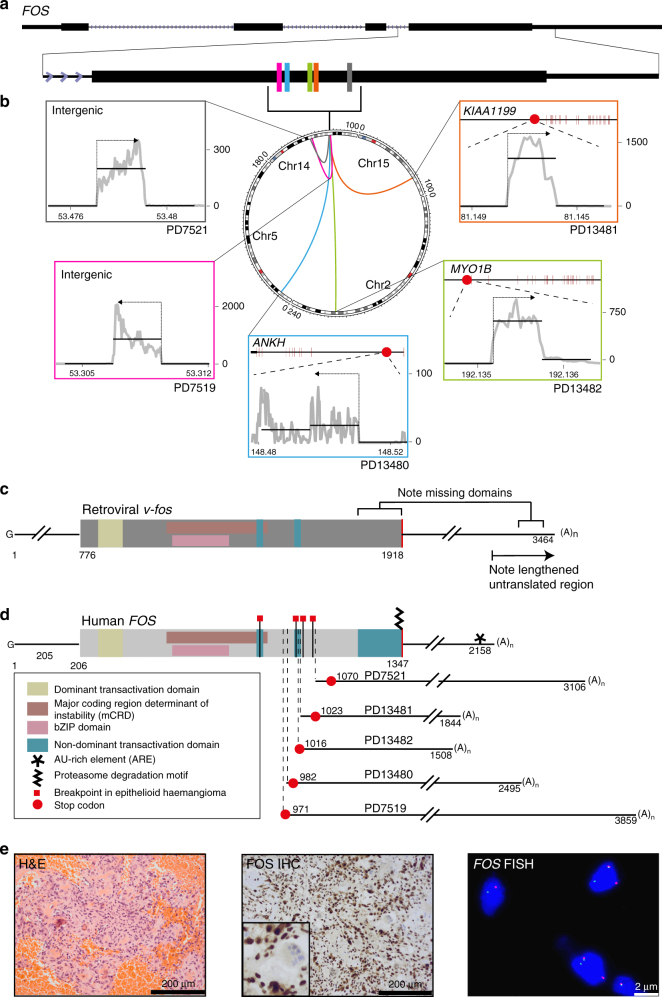
Fig. 1.
FOS fusions in osteoblastoma. a Clustered break points in FOS. b Central Circos plot showing the clustering of break points in FOS-mutant samples. All structural variants involving chromosome 14 are shown, demonstrating the paucity of genomic rearrangements. Surrounding panels demonstrate normalised RNA-Seq read counts for each fusion partner. Horizontal line segments reflect mean sequencing counts. The arrow above shows the direction of transcription of the fusion. c Retroviral v-fos. d Schematic of FOS break points in benign bone and vascular tumours generating similarity with the murine retroviral transforming v-fos. Subscript numbers from left to right report the length of the transcript to the stop codon and the predicted cleavage and poly-adenylation site, respectively. e FOS immunohistochemistry demonstrating strong nuclear immunoreactivity in FOS-mutant osteoblastoma, PD13482 (centre with zoom inset), Haematoxylin and eosin (H&E) (left), and a clear breakapart of FISH probes surrounding the FOS locus (right)

