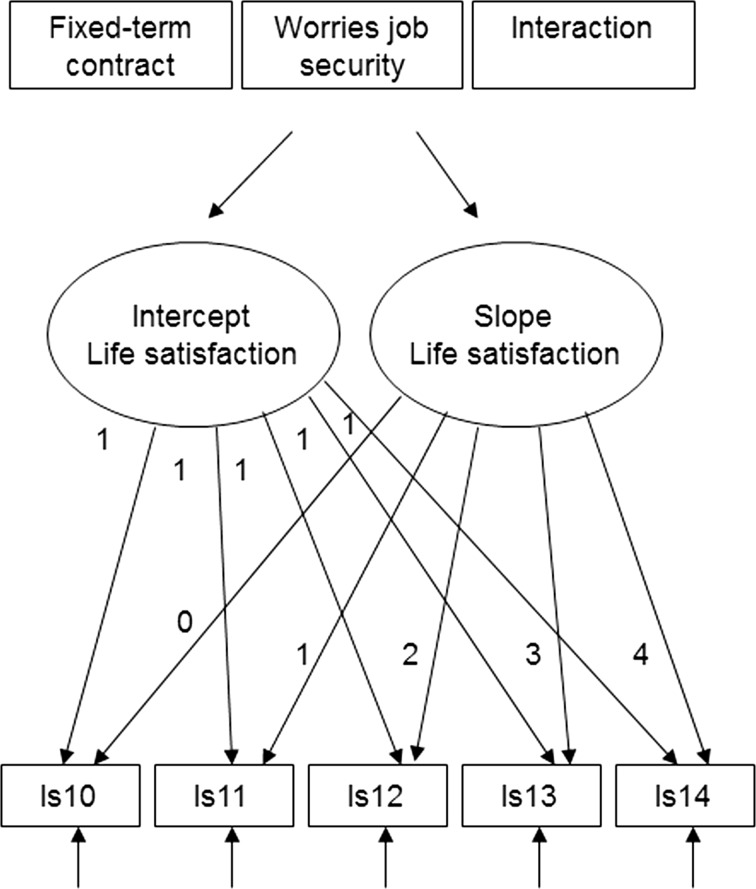
Fig. 2.
Conditional growth curve model. ls10–14 stand for life satisfaction in each of the years 2010–2014 For illustration purposes, the covariance among growth parameters as well as paths from each explanatory variable and control variables to latent growth parameters are not shown. Underlying this conditional growth-curve model is the baseline model illustrated in Fig. 1

