
Figure 2. Graph of CT score (A) and forced vital capacity percent predicted (FVC%) (B) by subject over 3 years of follow-up.
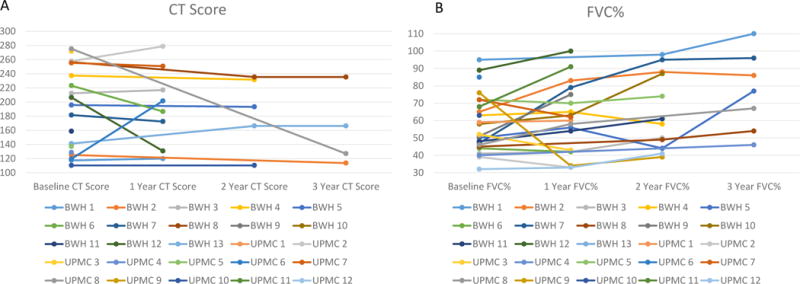
2A: Line graph of CT scores demonstrating stability or improvement (decrease in CT score) in ≥75% of subjects over the 3 years of follow-up.
2B: Line graph of FVC% demonstrating stability or improvement in ≥79% of subjects over the 3 years of follow-up.