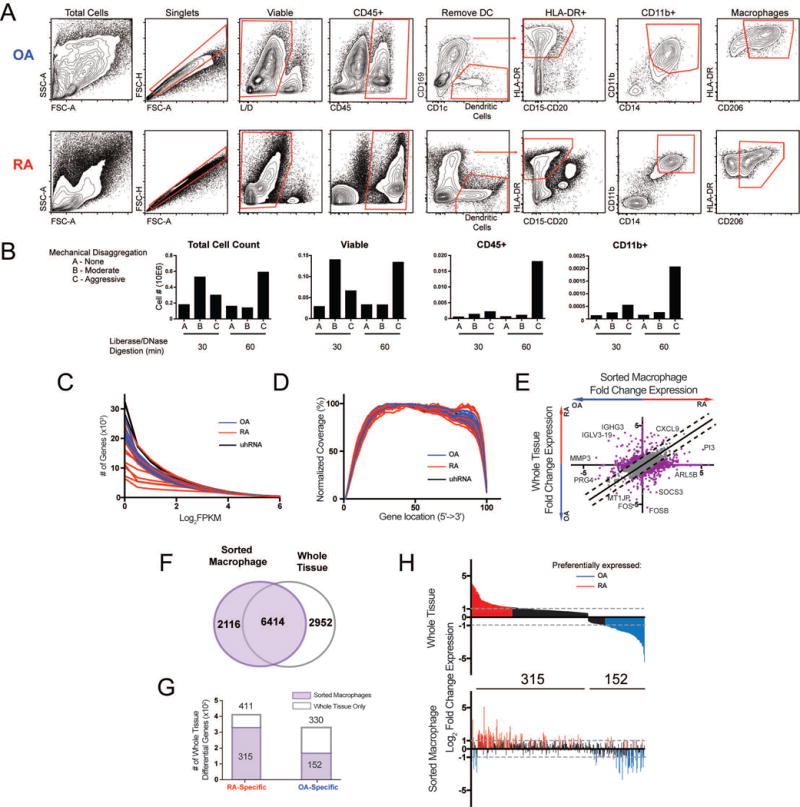
Figure 3.

Isolation of synovial macrophages and macrophage-specific RNA-seq. A. Gating strategy used to identify synovial macrophages in both RA and OA tissue. B. Optimization of the synovial tissue processing procedure. The success of the tissue processing was evaluated by the number of viable, CD45+, and CD11b+ cells identified by flow cytometry. C. Number of genes with expression greater than a given FPKM value for each sample. D. Gene coverage plot displays the average read density across genes from 5′ to 3′. E. Log2 fold change (Log2FC) of gene expression between RA and OA from whole tissue (y-axis) and macrophages (x-axis). Lines indicate differences >1. Select genes are displayed. F. Venn diagram comparing genes from sorted macrophages (purple) and whole tissue (grey outline). G. Bar graph of 741 differential genes from whole tissue (Figure 2D) that are also detected in sorted macrophages (purple). H. The Log2FC in expression of 467 differential genes from G detected in macrophages in whole tissue (top) and sorted macrophages (bottom). In both plots, genes are ordered along the x-axis by decreasing fold-change in whole tissue. Genes preferentially expressed in RA tissue (Log2FC>1) and OA tissue (Log2FC<−1) are colored in red and blue, respectively.
