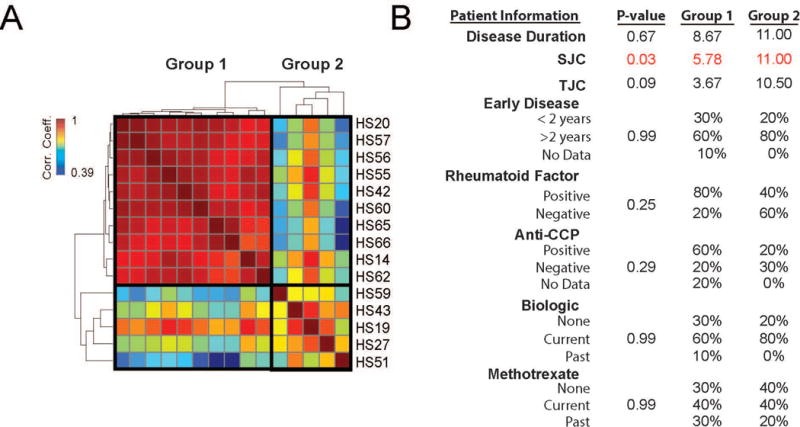
Figure 4.

Analysis of global gene expression profiles in sorted macrophages from RA. A. Pairwise Pearson correlation of gene expression between individual patient samples. Samples are organized by hierarchical clustering based on their Pearson coefficients across samples forming 2 groups. B. Table of association analysis between patients in Group 1 and Group 2 as defined in A and clinical parameters. Values reflect either the group average (continuous variables) or percent of patients (categorical variables) in each group with given criteria. P-values for disease duration, SJC and TJC were determined by Student’s t-test and for early disease duration, rheumatoid factor, anti-CCP antibody and treatment status were determined by Fisher’s exact test. Significant values are shown in red. TJC=tender joint count; SJC=swollen joint count; CCP=cyclic citrullinated peptide
