
Figure 5.
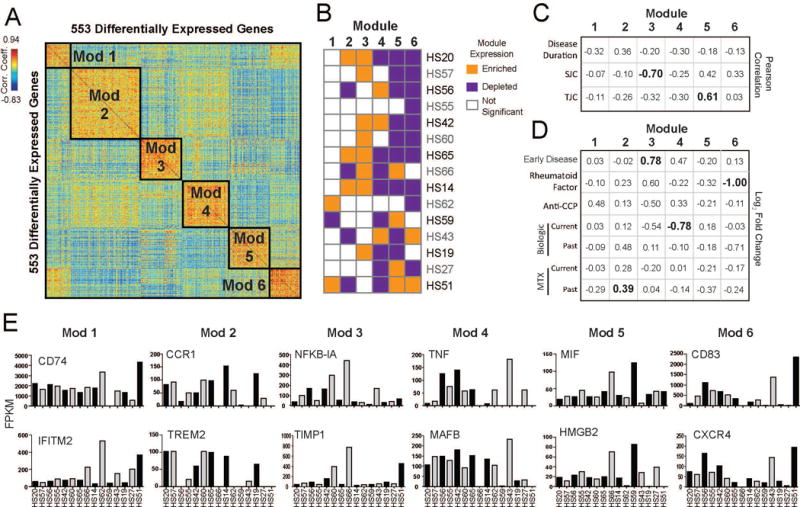
A. Pairwise Pearson correlations between 553 differentially expressed genes of their expression across sorted macrophages from RA patients. Genes are clustered using k-means to identify modules of co-regulated genes (Modules 1-6). B. Kolmogorov-Smirnov test to determine if expression of module genes is enriched (orange) or depleted (purple) in each patient (p-value<0.05). C. Table of association displaying the Pearson correlation between the median expression of gene modules in patients and the given clinical parameters (continuous variables) were calculated. Correlation coefficients with a p-value <0.05 are shown in bold. D. Table of association displaying the average fold-change (Log2FC) between median expression of gene modules in patients that were positive vs. negative for the given clinical parameters (categorical variables). Current medication treatment compares patients who were currently on the medication against those who were not on the medication at the time of biopsy. Past medication treatment compares patients who had stopped medication against those who were never on a given medication. Significant comparisons (p-value<0.05, t-test) are shown in bold. MTX=methotrexate. E. Bar graph showing the expression levels (FPKM) across patients with RA of individual genes selected across the 6 Modules.