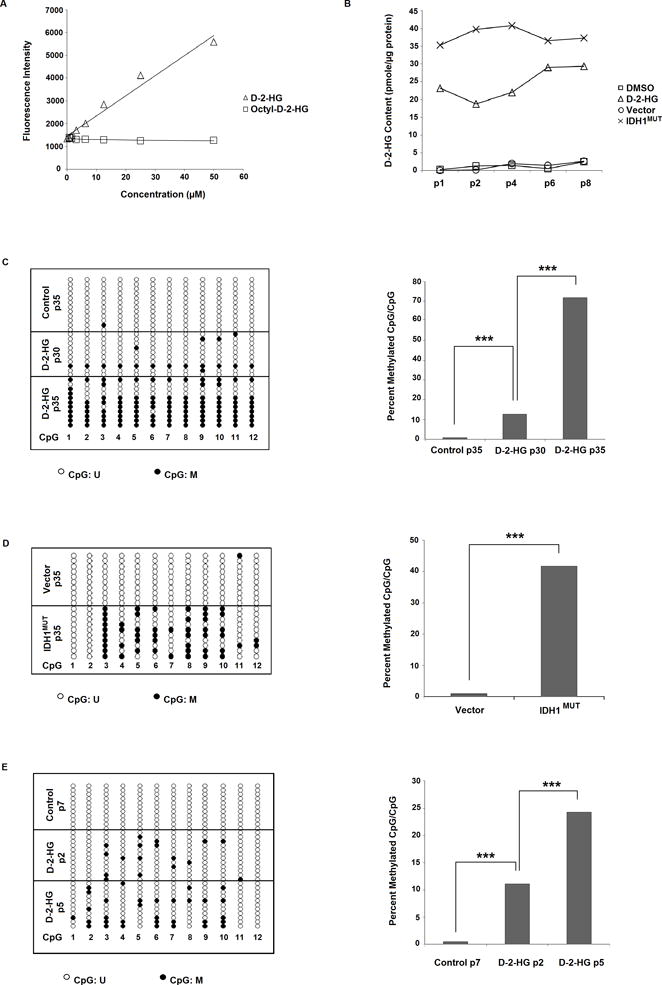
Figure 1. Induction of MIR148A promoter methylation in 293T cells and normal human astrocytes (NHAs) by octyl-D-2-HG and octyl-L-2-HG.

A: Enzymatic D-2-HG assay is not able to detect octyl-D-2-HG. Intensity levels increase with application of D-2-HG, but remain unchanged with increasing concentrations of administered octyl-D-2-HG. B: Intracellular D-2-HG content is elevated with octyl-D-2-HG compared with vehicle-treated 293T cells, and is also elevated in IDH1MUT- versus empty vector-transfected 293T cells. C: Octyl-D-2-HG treatment induces CpG island methylation in 293T cells with >30 passages of treatment. Bis-Seq-TA cloning assay in control 293T cells (35 passages) show that MIR148A is unmethylated, while in octyl-D-2-HG treated cells (30 and 35 passages) MIR148A is partially methylated. Representative lollipop diagram of TA cloning showing methylation status of individual CpG sites (left, n=1). Ratio of methylated CpGs/total CpGs in detected MIR148A promoter region (right). D: IDH1MUT induces miR148a promoter CpG methylation in 293T cells. 293T cells were transfected with empty vector (pLPCX) or pLPCX-IDH1R132H for 35 passages. Representative lollipop diagram of TA cloning showing methylation status of individual CpG sites (left, n=1). Ratio of methylated CpGs/total CpGs in detected MIR148A promoter region (right). E: Octyl-D-2-HG treatment induces rapid CpG island methylation in NHA cells. Lollipop diagram showing MIR148A methylation by Bis-Seq-TA cloning (left, n=1). Figure showing ratio of methylated CpGs/total CpGs (right). Statistical analysis performed using chi-squared analysis. *** indicates p<0.001, ** indicates p<0.01 and * indicates p<0.05 compared with control. U = unmethylated, M = methylated.
