
Figure 4. Epigenetic regulation of MIR148A promoter activity by DNA CpG methylation.
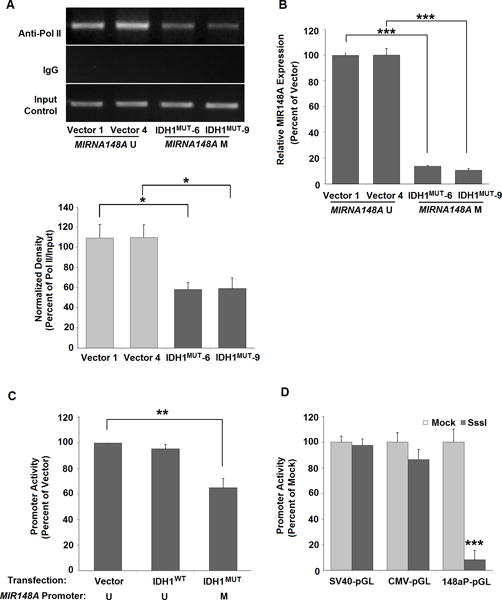
A: Decreased recruitment of Pol II to the MIR148A promoter after development of MIR148A methylation in IDH1MUT-293T cells compared to vector-293T cells at passage 30. Bar graph shows MIR148A ChIP-PCR relative density measured via ChIP-PCR. For each transfection, two clonal cell lines were tested (n=2, bars show SEM). B: Figure showing decreased MIR148A expression in IDH1MUT-293T cells compared to vector-293T cells at passage 30 as detected by RT qPCR (n=2, bars show SEM). C: Methylation reduces MIR148A promoter-pGL activity in IDH1MUT-293T cells. Figure shows blank vector-, IDH1WT- and IDH1MUT - 293T cells at passage >40 as determined by luciferase assay (n=3, bars show SEM). D: MIR148A promoter activity is decreased by in vitro methylation with SssI treated miR148a-pGL (n=3), CMV-pGL (n=2) and SV40-pGL transfection (n=2; all bars show SEM). Each was either pre-methylated by in vitro SssI reaction or treated with mock reaction without SssI, and activity was determined by luciferase assay. Statistical analysis for all data performed using two-tailed student t-test. *** indicates p<0.001, ** indicates p<0.01 and * indicates p<0.05 compared with control. U = unmethylated, M = methylated.