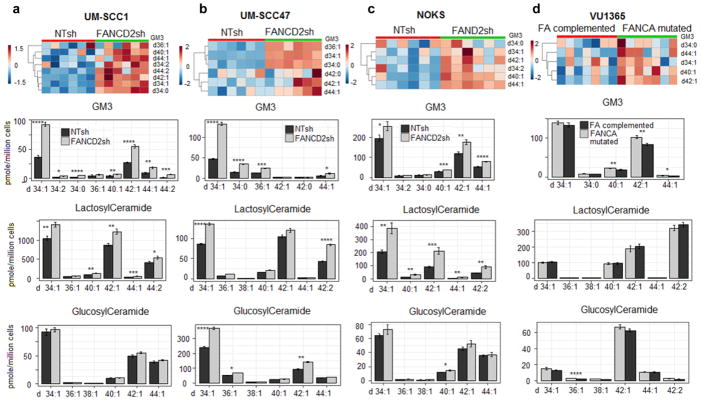
Figure 3. Targeted analysis of lipids of ganglioside GM3 metabolic pathway in NTsh and FANCD2 deficient SCC cells, UM-SCC1 (n=6 per cell population) (a), UM-SCC47 (n=6 per cell population) (b), NOKS cells (n=6 per cell population) (c), and FANCA mutated and complementation VU1365 cells (n=6 per cell population) (d).
Heatmap of targeted UPLC-MS/MS analysis of ganglioside GM3 species in NTsh and FANCD2 knockdown UM-SCC1, UM-SCC47, NOKS cells, and FANCA mutated and complementation VU1365 cells, the estimated false discovery rates (q value) for calling all p-values < 0.05 significant were 0.013 for UM-SCC1, 0.023 for UM-SCC47, 0.074 for NOKS, and 0.072 for VU1365 cells, i.e. under 10% false discovery rate.
Targeted quantitative analysis of glucosylceramides, lactosylceramides, and ganglioside GM3, in NTsh and FANCD2 knockdown UM-SCC1 and UM-SCC47 cells; NOKS and FANCA mutated and complementation VU1365 cells. * p-value < 0.05, **p-value < 0.01, *** p-value < 0.001, ****p-value < 0.0001 (two-tailed student’s t test)

