
Figure 5. WNT signaling anti-correlated with T-cell infiltration.
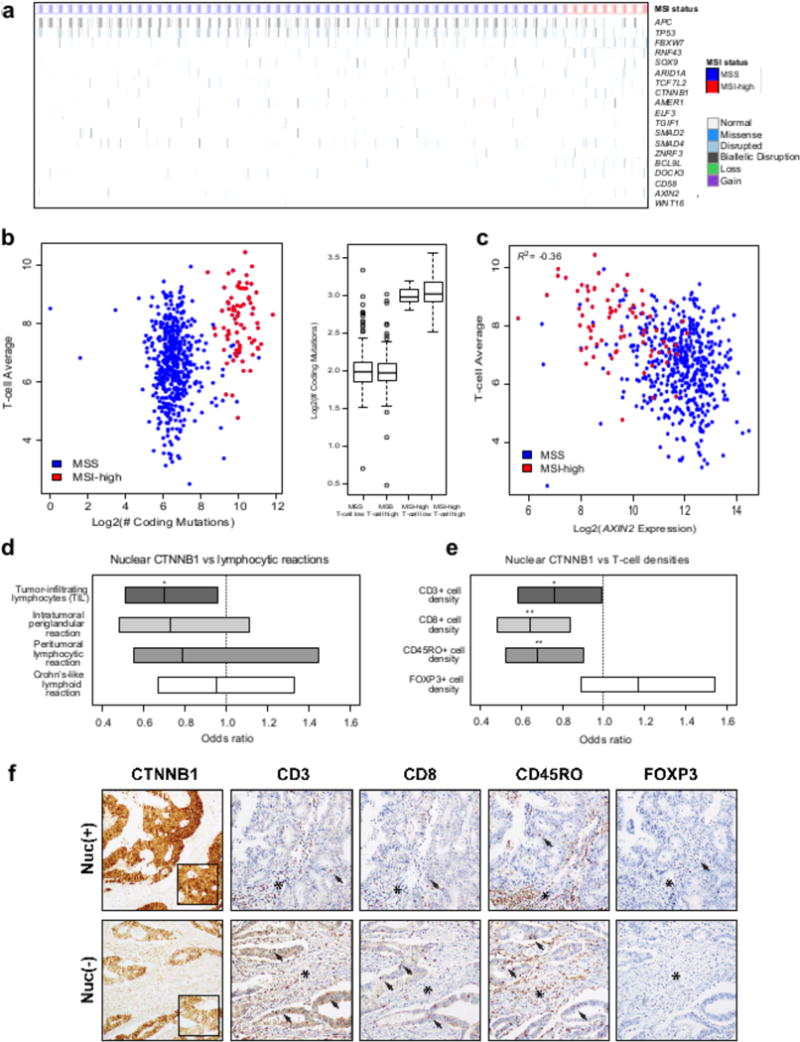
a, Mutation landscape of significantly mutated genes involved in WNT signaling in MSS versus MSI-high tumors. b, Scatterplot showing T-cell average versus the number of coding mutations in MSS and MSI-high samples. Box and whisker plot of the number of coding mutations versus T-cell-inflamed status (“T-cell high” samples are those with T-cell average greater than the median for MSS and MSI-high.) c, Scatterplot showing the T-cell average versus AXIN2 gene expression in MSS and MSI-high samples. d, Immunohistochemical analysis of T lymphocyte infiltrates according to nuclear CTNNB1 (beta-catenin) status. Box plot showing that nuclear CTNNB1 is anti-correlated with tumor-infiltrating lymphocytes (P=0.027). Boxes are 95% confidence intervals; lines are estimated odds ratios. Crohn’s-like reaction was defined as transmural lymphoid reaction. Peritumoral lymphocytic reaction was defined as discrete lymphoid reactions surrounding tumor. Intratumoral periglandular reaction was defined as lymphocytic reaction in tumor stroma within tumor mass. TIL was defined as lymphocytes on top of cancer cells. e, Box plot showing that nuclear CTNNB1 is anti-correlated with CD3+ density (P=0.054), CD8+ density (P=0.0019), CD45RO+ density (P=0.0080), but not FOXP3+ density (P>0.1). (* P<0.1, ** P<0.01 for d-e.) f, The top row depicts a tumor with positive nuclear staining for CTNNB1 (left panel, highlighted by inset) that harbors a low level of CD3, CD8, and CD45RO-positive tumor infiltrating lymphocytes (arrows) compared to the tumor in the bottom row that shows a membranous-only expression pattern for CTNNB1 and harbors higher levels of CD3, CD8, and CD45RO-positive tumor infiltrating lymphocytes. In contrast, levels of FOXP3-positive T lymphocytes are lower than the other T cell subsets and do not show a significantly different density based on nuclear CTNNB1 status. Note that the degree of periglandular lymphocytic response (marked by asterisks) within the stroma is not significantly impacted by nuclear CTNNB1 status.