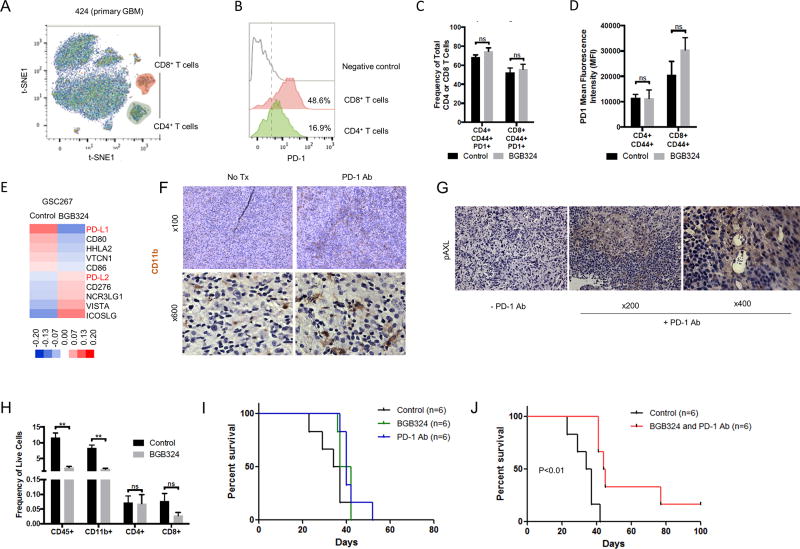
Figure 5.
Co-treatment with BGB324 and PD-1 antibodies improves survival in mouse GBM models. A. Detection of CD4 (CD45+ CD3+ CD8+ CD4+) and CD8 T (CD45+ CD3+ CD4− CD8+) cell from primary GBM dissociated cells (424) after selection of CD45+ selection by CyTOF. B. Detection of PD-1 in CD4 and CD8 T infiltrating cells primary GBM tumor (424). Negative control: naïve CD8 T cells from blood. C–D. Effect of BGB324 on activated intratumoral T cells expressing PD-1. (C) Frequency of total CD4(+) or CD8(+) T cells in mouse tumors from mice treated with BGB324 for 10 days (50 mg/kg/day). (D) mean fluorescence intensity (MFI). E. Heat map of the B7 family generated using microarray data obtained from GSC267 xenograft tumors treated with BGB324. F. IHC analysis showing CD11b staining in a representative sample of a MS7080 tumor from mice treated with PD-1 antibody (Ab). G. IHC analysis of mouse tumors from mice treated with PD-1 Ab using pAXL Ab. H. The frequency of infiltrating CD45(+), CD11b(+), CD4(+), or CD8(+) cells in mouse tumors from mice treated with BGB324. F. Kaplan-Meier curve of MS7080 tumor-bearing mice treated with PD-1 Ab four times (10 mg/kg, days 3, 7, 10 and 13) or BGB324 for 10 days (50 mg/kg/day). G. Kaplan-Meier curve for mice with MS7080 tumors treated with PD-1 Ab four times (10 mg/kg, days 3, 7, 10 and 13) and BGB324 for 10 days (50 mg/kg/day).

