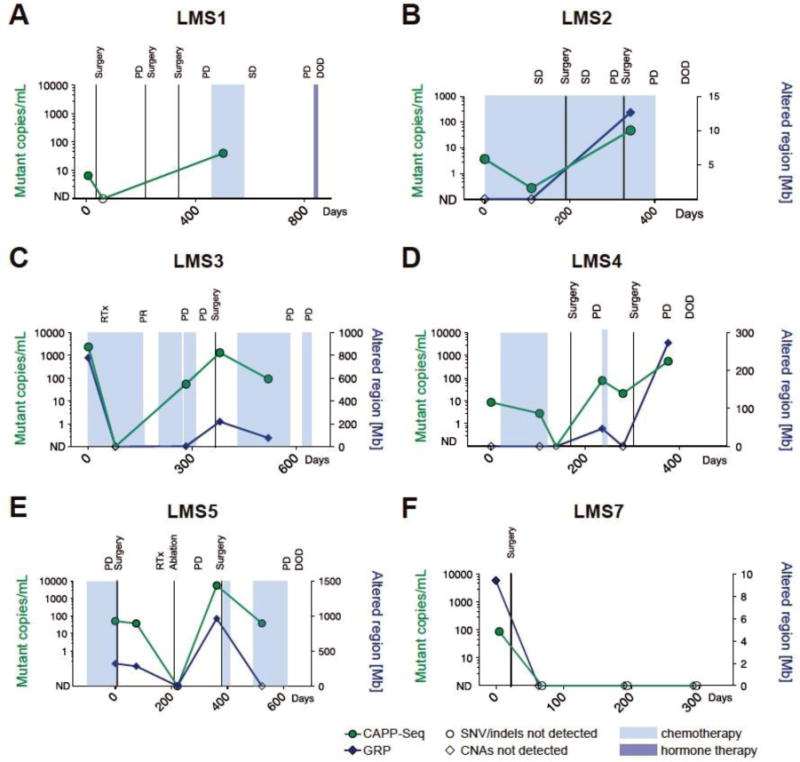
Figure 3.

Patient-specific ctDNA profiles characterized by CAPP-Seq and GRP. The levels of ctDNA decreased in selected patients in response to surgery (LMS1 and LMS7) or chemotherapy (LMS2, LMS3, LMS4). In patients LMS1, LMS2, LMS3, LMS4 and LMS5, the increasing levels of ctDNA correlated with progression of disease throughout the treatment. (SD – stable disease; PD – progressive disease; DOD – dead of disease; Mb - megabases)
