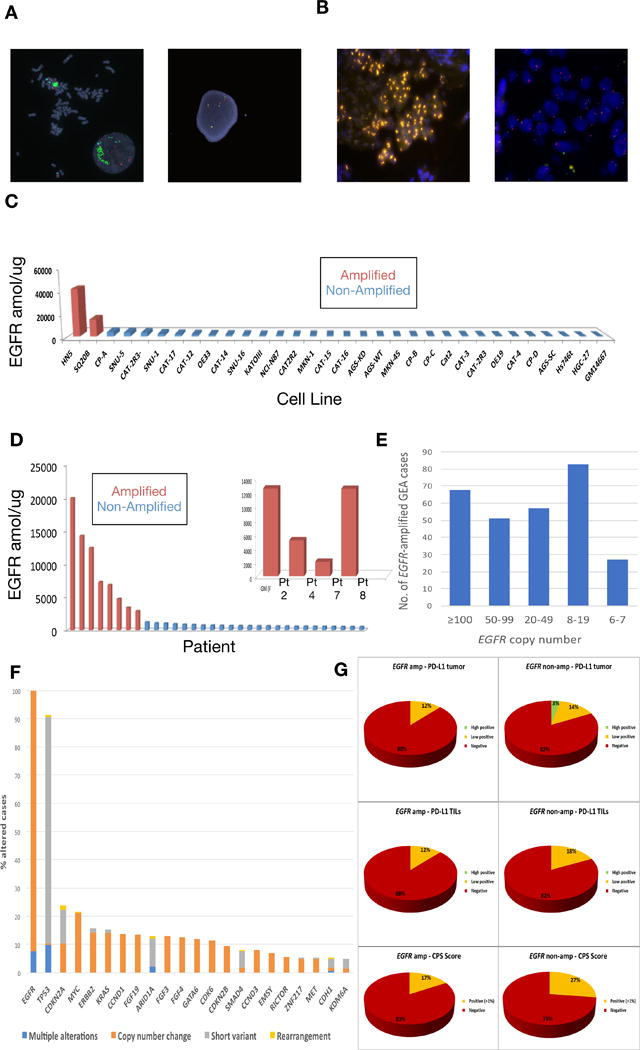
Figure 1.

EGFR amplification and expression assessment in cancer cell lines and tissues. (A) FISH demonstrating EGFR amplification of HN5 cells (left) and lack of EGFR amplification in SNU-5 cells (right) (Polysomy with 4 copies of both EGFR (green) and CEP7 (orange) control probes). (B) FISH demonstrating EGFR amplification (orange) within the gastric primary tumor of patient 2 (left) and absence of EGFR amplification within a liver metastasis of patient 5 (right). (C) EGFR selected reaction monitoring (SRM) by amplification status in selected cell lines (red amplified by FISH ratio ≥2, blue not amplified). (D) EGFR selected reaction monitoring (SRM) by amplification status across retrospective cohort and overlay including EGFR amplified patients from the prospective cohort when adequate tissue was available for analysis (red amplified by FISH ratio ≥2 and/or NGS copy ≥8, blue not amplified). (E) Of 4645 patients undergoing Foundation One testing at Foundation Medicine, 259 (5.6%) demonstrated EGFR amplification, displayed by copy number ranges >100, 50-90, 20-49, and 8-19. Although clinical reports do note ‘equivocal’ amplification with 6-7 copies, these were considered negative for this study. (F) Concurrent genomic alterations occurring in ≥5% of EGFR amplified tumors (≥8 EGFR gene copies) within the Foundation Medicine cohort (N=259). (G) PD-L1 IHC testing (Ventana SP142, see methods) of 632 GEA samples performed at Foundation Medicine in the entire cohort, by anatomical location (proximal esophagogastric junction (EGJ) versus distal gastric) and EGFR amplification status, reported as percent tumor positivity score (TPS), percent tumor infiltrating lymphocytes (TILs) positivity, and combination of these for a combined positivity score (CPS).
