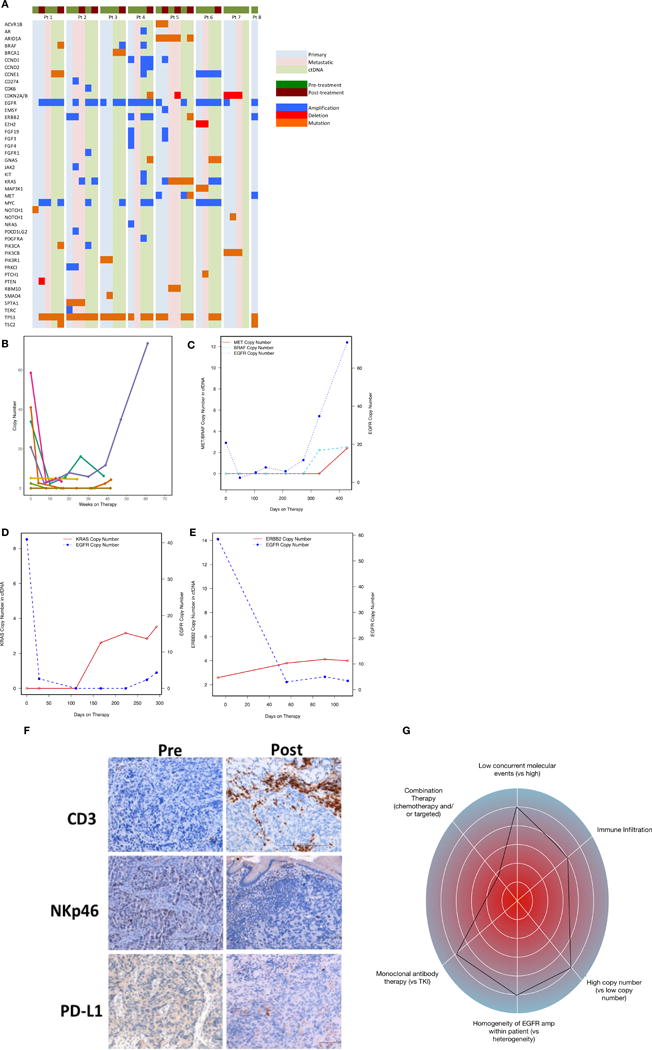
Figure 4.

Molecular and immunological correlatives of EGFR amplified samples treated with anti-EGFR therapy. (A) Comparison of intra-patient and inter-patient significant genomic alterations in primary tumor DNA, metastatic tumor DNA, and circulating tumor DNA pre/post anti-EGFR therapy. (B) Serial ctDNA EGFR copy number for all treated patients. (C) Serial ctDNA for pt #3 demonstrating decline of EGFR copy number when cetuximab was begun followed by rise in EGFR copy number when MET and BRAF amplification arose at the time of radiographic progression. (D) Serial ctDNA for pt #2 revealing steep decline in EGFR copy number after FOLFOX and later ABT-806 initiation with cycle 3 followed by rise in KRAS copy number at the time of occult peritoneal disease growth leading to hydronephrosis. (E) Serial ctDNA for pt #4 demonstrating sharp decline in EGFR copy number after cetuximab administration with concomitant rise in ERBB2 copy number at the time of clinical progression and progressive liver failure. (F) IHC assessment for CD3+, NKp46+, and PD-L1+ cells pre-/post anti-EGFR therapy demonstrating increased inflammation within primary tumor from pt #1. (G) “Genogram” figure of patient 3. A framework detailing predictive factors favoring response to genomic targeted therapy are towards the periphery including i) intrapatient homogeneity of EGFR amplification therapy, ii) higher EGFR copy number, iii) combination of chemotherapy + EGFR antagonist, iv) fewer concurrent molecular events, v) monoclonal EGFR antibody use, and vi) increased CD3 infiltration of tumor and stroma. This patient 3 demonstrated homogeneous and high EGFR amplification at baseline, with moderate immune infiltrate, and without concurrent resistance mechanisms. He therefore would be predicted to derive significant benefit, despite being in the third line setting and with monotherapy; he had a complete response lasting 61 weeks.
