
Figure 3. MDA-9/Syntenin regulates STAT3 activity in PCa cells.
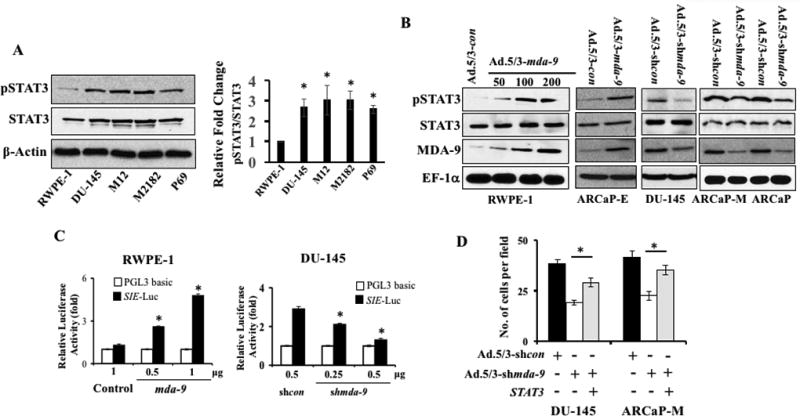
A) Western blotting analysis of phospho-STAT3 (Tyr705) and total STAT3 (left panel). Band intensity was quantified and relative-fold change in different cancer cells vs. RWPE-1 is presented (right panel). Average with S.D. from three independent experiments. “*” represents statistical significance (p<0.05) between indicated groups. B) Cells were either infected with adenoviruses for 48 hours and reseeded on fibronectin-coated plates. Total cell lysates prepared 1 hour after plating and Western blotting using indicated antibodies. C) Cells were co-transfected with a reporter gene and empty vector, mda-9/syntenin or mda-9/syntenin shRNA and after 48 hours, luciferase activity was measured. Data presented as fold-change vs. the control group (empty vector). D) Cells were co-transfected with different expression plasmids and 48 hours later, cells were trypsinized and invasion assayed. Cells counted using bright field microscopy.