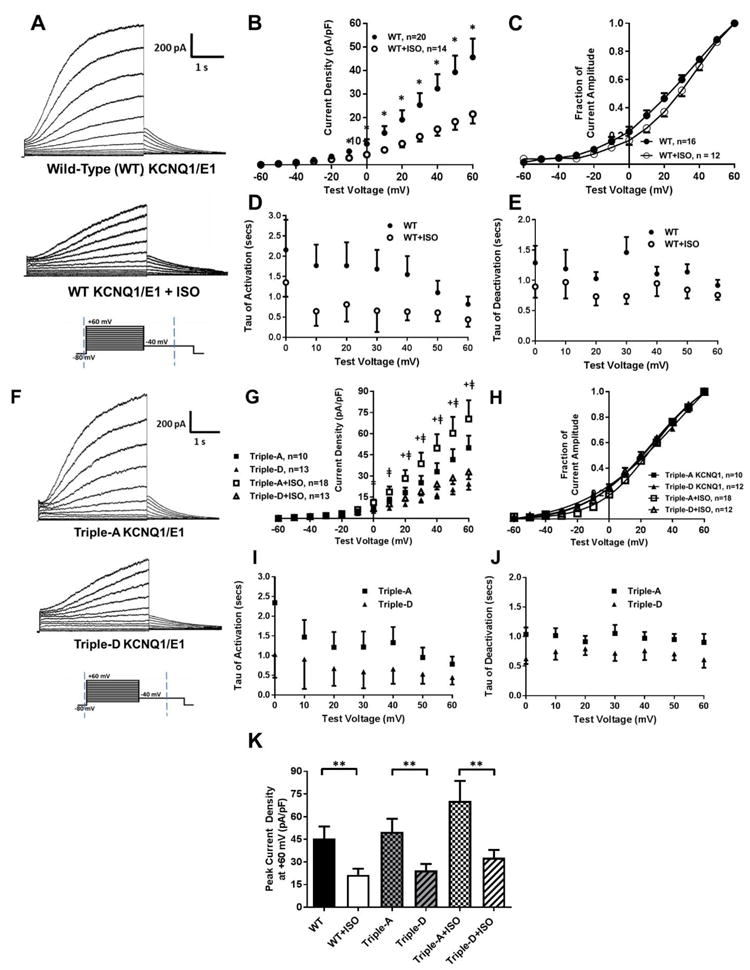
Figure 2.

(A) Representative traces of IKs activation currents from WT KCNQ1/KCNE1 following 100 nM ISO or vehicle for 12-24 hours. (B) I-V plots, (C) activation curves (normalized to the voltage of maximum activation), and (D) rate constants of activation and (E) deactivation following treatment with ISO or vehicle. (F) Representative traces of IKs from KCNQ1 combination mimics of dephosphorylation (Triple-A) and phosphorylation (Triple-D) co-expressed with KCNE1. (G) I-V plots, (H) activation curves, and (I) rate constants of activation and (J) deactivation for Triple-A and Triple-D KCNQ1. (K) Peak current density at +60 mV for WT KCNQ1 and combination mimics following ISO or vehicle. *p<0.05 vs. WT+ISO, + p<0.05 for Triple-A vs. Triple-D, ǂp<0.05 for Triple-A+ISO vs. Triple-D+ISO, **p<0.05 for comparison indicated
