
Figure 5.
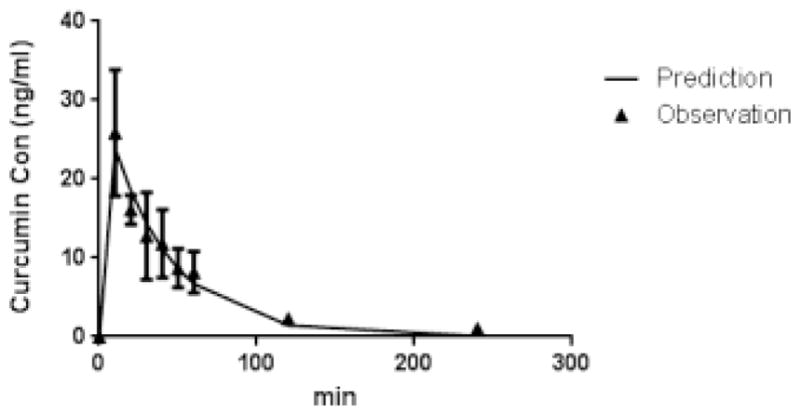
Rat CUR plasma pharmacokinetics profile after oral administration of CUR (250 mg/kg) by two-compartment model. Solid triangles with error bar represent the observed mean plasma concentration with standard deviation and the solid line represents the two-compartment analysis and prediction for CUR oral pharmacokinetics results.