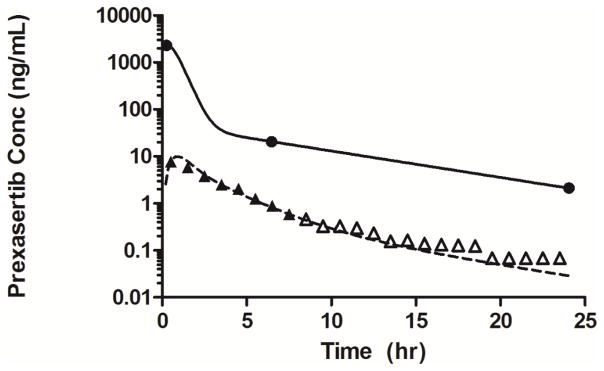
Fig. 5.
Prexasertib concentration-time profiles in plasma and tumor extracellular fluid (ECF) for a cerebral microdialysis experiment in one representative mouse bearing a Group 3 MB tumor (closed circles represent observed prexasertib concentrations in plasma, and the solid line represents model predicted concentrations in plasma; closed and open triangles represent recovery corrected prexasertib concentrations in microdialysate above and below the LLOQ, respectively. The dashed line represents model predicted concentrations in microdialysate).

