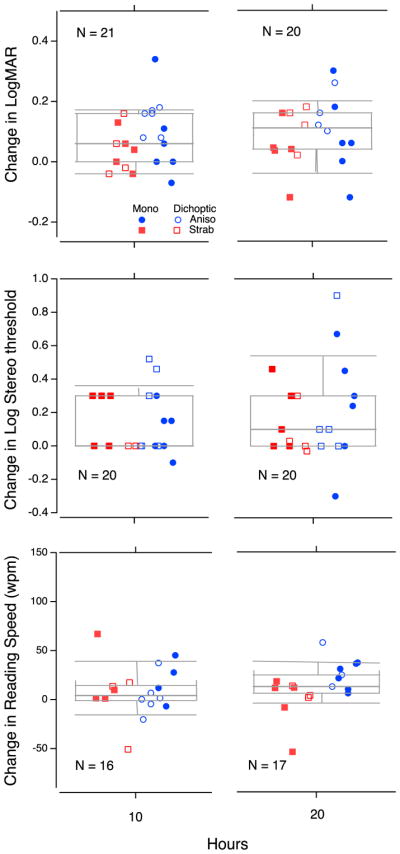
Figure 4.

Box plots showing change in performance for visual acuity (top panels), stereoacuity (middle panels) and MN read (bottom panels). In each boxplot, the center horizontal bar is the median, the box shows the semi-interquartile range, and the whiskers the 9th and 91st percentile. Change scores are shown following 10 hours (left plots) and 20 hours (right plots) of training, relative to baseline. Changes are shown for monocular (filled symbols) and dichoptic (open symbols) training participants. Color- and shape-coding denotes amblyopia type: aniso (blue, circle) or strab (red, square). The number of participants contributing to each measurement is reported at the bottom of each plot. Note that the horizontal positions of the data points have been jittered to avoid overlap.
