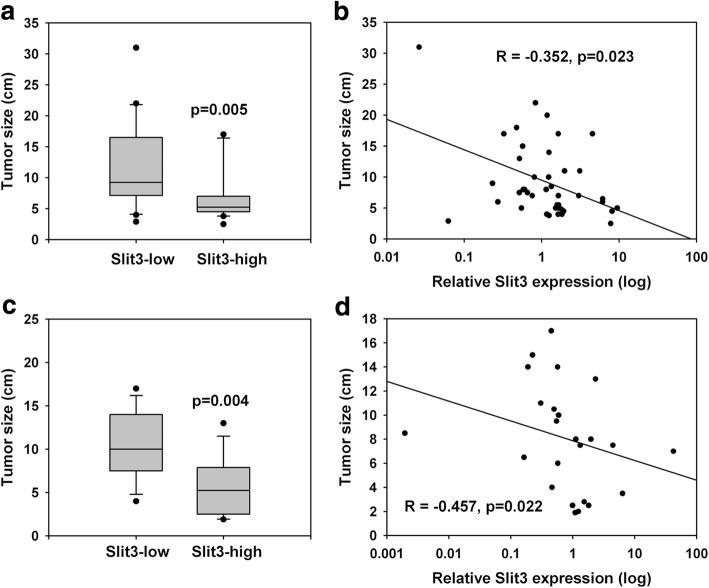
Fig. 1.
Slit3 repression correlated with HCC tumor growth. a Tumor size of HCC patients cohort 1 (n = 40) with high or low Slit3 expression. b Relative Slit3 expression inversely correlated with tumor size of HCC patients cohort 1 (n = 40). c Tumor size of HCC patients cohort 2 (n = 25) with high or low Slit3 expression. d Relative Slit3 expression inversely correlated with tumor size of HCC patients cohort 2 (n = 25)

