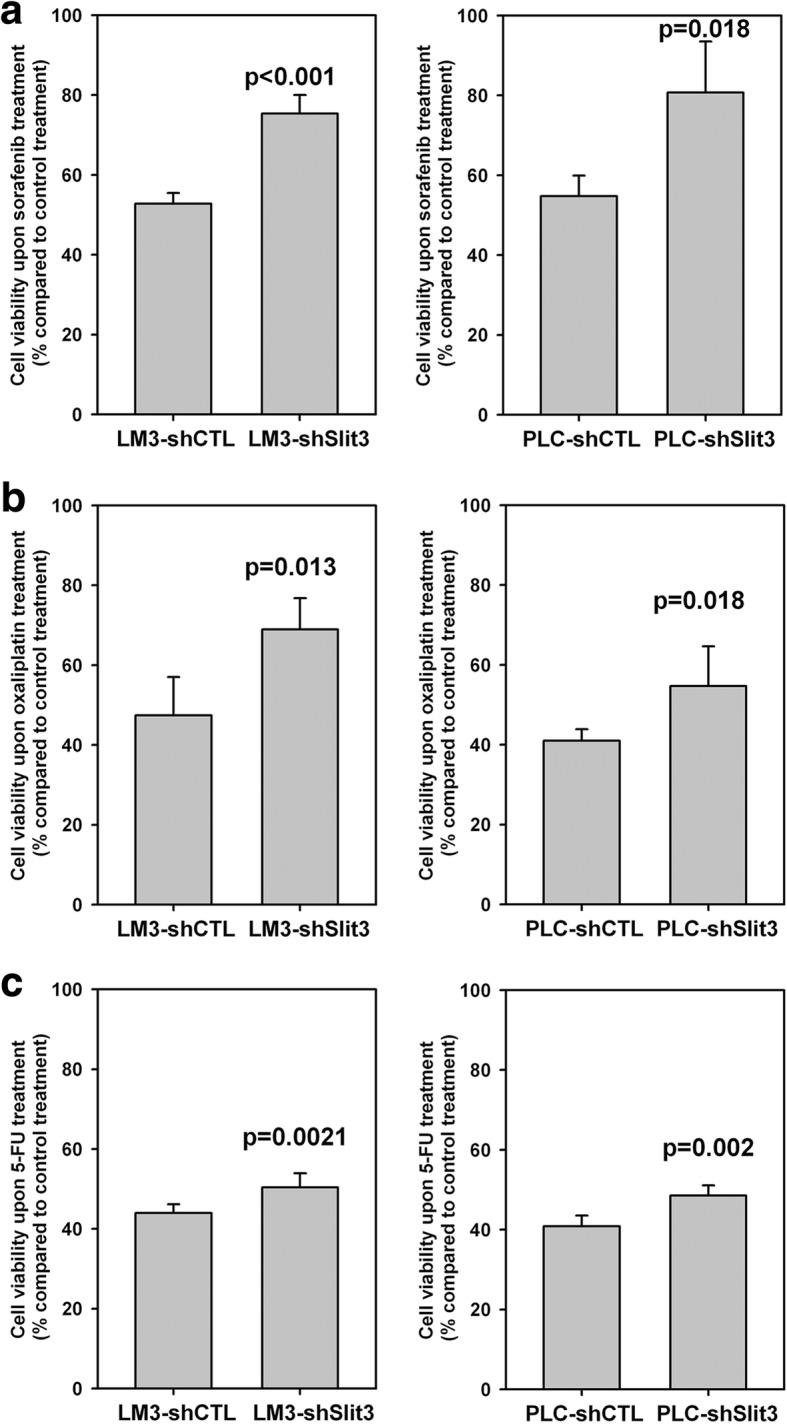
Fig. 5.

Stable repression of Slit3 expression enhanced chemoresistance in HCC cells. (Left panel) LM3-shSlit3 and shCTL cells and (right panel) PLC-shSlit3 and shCTL cells were treated with (a) 10 μM sorafenib, (b) 10 μM oxaliplatin and (c) 100 μM 5-FU for 72 h. The number of cells was determined by MTT assay and expressed as percentage of that under vehicle control treatment. When compared with shCTL cells, shSlit3 cells showed significantly stronger resistance to the treatment of all chemotherapeutic drugs. Each experiment was performed in triplicate and data was obtained from three independent experiments
