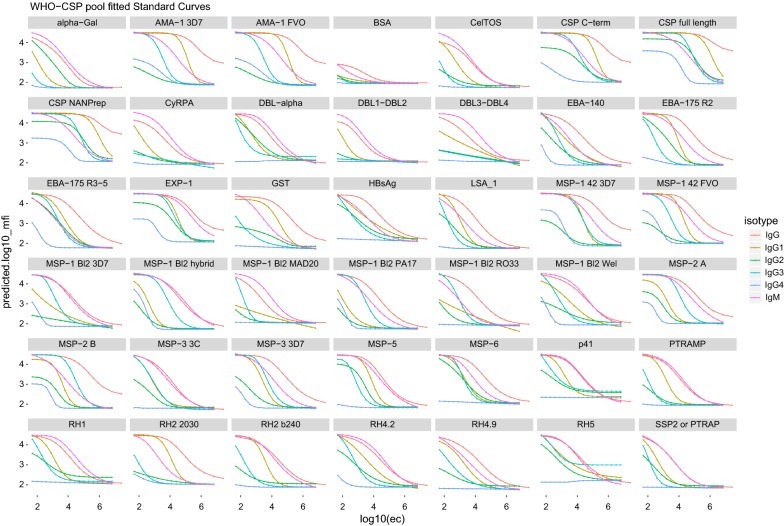
Fig. 2.
IgG, IgG1–4 and IgM fitted curves using the WHO-CSP pool to the 40-antigen multiplex panel incubating at 4 °C ON. Lines and dots represent predicted levels from 5PL, 4PL or exponential regression equations from 23 titration curves for IgG, IgG1, IgG3 and IgM; and 12 curves for IgG2 and IgG4. Titration curves contained 18 serial dilutions (1:2) starting at 1/50 of the WHO-CSP pool to a panel of 39 P. falciparum antigens plus HBsAg, α-Gal, BSA and GST

