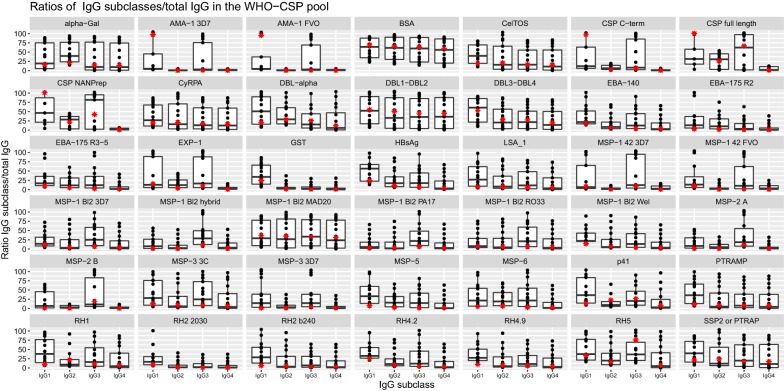
Fig. 3.
Boxplots of ratios of IgG1–4 subclasses to total IgG measured in the WHO-CSP pool. Ratios are composed with the median of the 23 titration curves for IgG, IgG1 and IgG3 and 12 curves for IgG2 and IgG4, for each dilution point. Boxes show medians and interquartile ranges. The red star corresponds to the ratio of the median of each dilution of IgG subclass to the median of each dilution of total IgG

