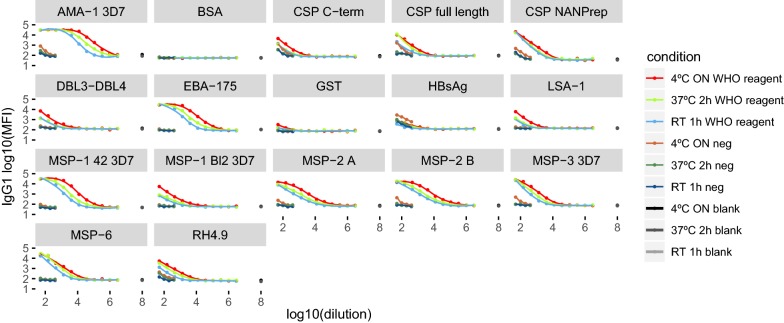
Fig. 4.
Levels of IgG1 measured to 15 antigens in the WHO reference reagent compared to negative control and blanks under three different incubation conditions. Curve plots of the antigen-specific IgG1 levels measured in serial dilutions of the WHO reference reagent, negative control and blanks at three different incubation conditions: 37 °C 2 h, 4 °C overnight (4 °C ON) and room temperature 1 h (RT 1 h). “neg” means negative control

