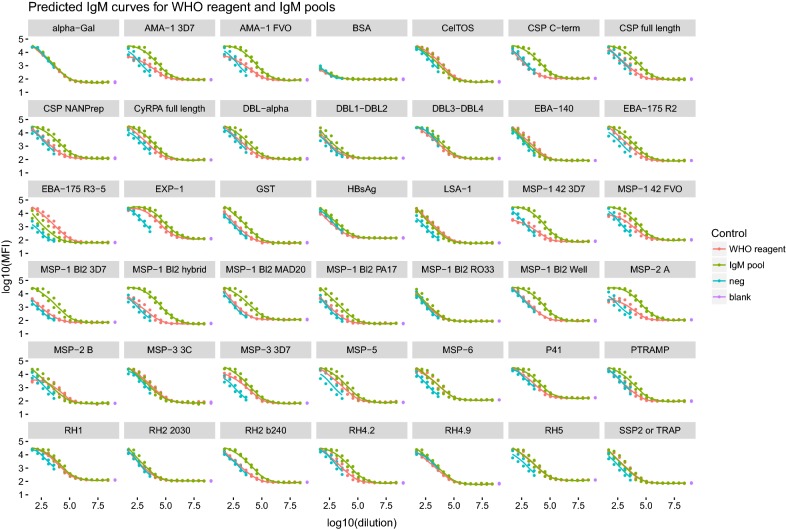
Fig. 5.
Fitted IgM curves to the 40-multiplex panel in the WHO reference reagent and the IgM pool compared to negative control and blanks under two different incubation conditions. Curves from 4PL or 5PL logistic model equation comparing IgM levels measured in the WHO reference reagent, the IgM pool, the negative control and the blanks. Isolated dots in purple represent the IgM levels measured in the technical blanks

