Fig. 2.
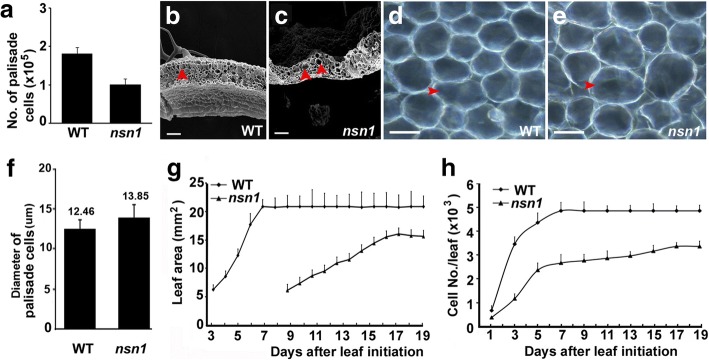
Inefficient cell proliferation in nsn1 leaves. The fifth leaf pair was used for measurement and analysis. a Statistical analysis of the number of palisade cells from fully expanded leaves. Scanning electron microscope (SEM) images of fully expanded leaves of wild type (b) and nsn1 (c). Arrow heads indicate the palisade cells with similar size from the two genotypes. The palisade cells of fully expanded leaves of wild type (d) and nsn1 (e). f Statistical analysis of the diameter of palisade cells from fully expanded leaves. g Dynamics of leaf expansion of wild type and nsn1. h Dynamic analysis of cell number/leaf of wild type and nsn1. The difference between the two datasets was analyzed by Student’s t test (P < 0.01). Scale bars: 50 μm for (b) and (c); 10 μm for (d) and (e)

