Fig. 4.
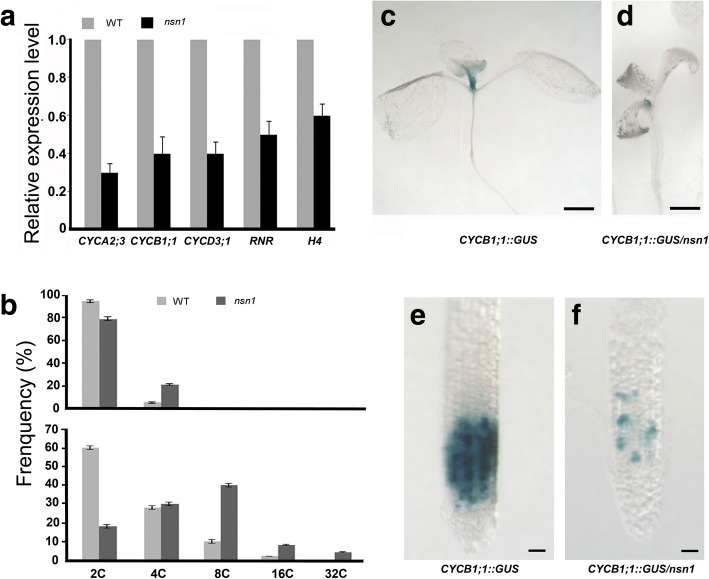
Analysis of cell cycle defects in nsn1. a Relative transcriptional levels of cell cycle genes in nsn1 as measured by q-RT-PCR. Ten-day-old seedlings shown in Fig. 1e were used for total RNA extraction after the root length measurement. Three biological replicates were conducted with 15 plants for each experiment. b Flow cytometry assay of nuclei isolated from leaves of 4-days after initiation (upper panel) and of fully-expanded fifth leaves (lower panel). c-f Histochemical analysis of GUS signal in ten-day-old seedlings of indicated genotypes. GUS signal in the shoot apical meristem (c) and root meristem (e) of CYCB1;1::GUS expressing wild type plants stained with X-glux solution. GUS signal in the shoot apical meristem (d) and root meristem (f) of CYCB1;1::GUS expressing nsn1 plants stained with X-glux solution. Scale bars: 0.5 mm for (c) and (d); 100 μm for (e) and (f)

