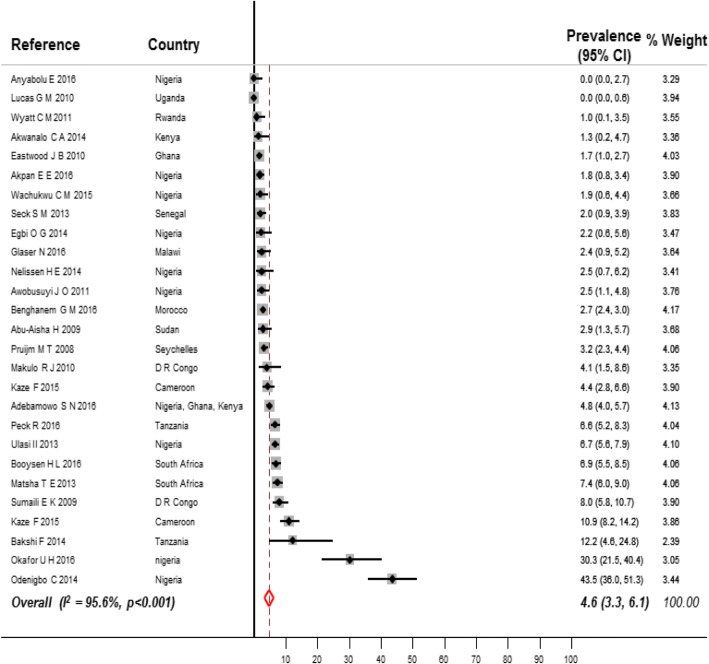
Fig. 4.
Prevalence of CKD stages 3 to 5 in general populations of adults living in Africa. Black boxes represent the effect estimates (prevalence) and the horizontal bars are for the 95% confidence intervals (CIs). The diamond is for the pooled effect estimate and 95% CI and the dotted vertical line centered on the diamond has been added to assist visual interpretation

