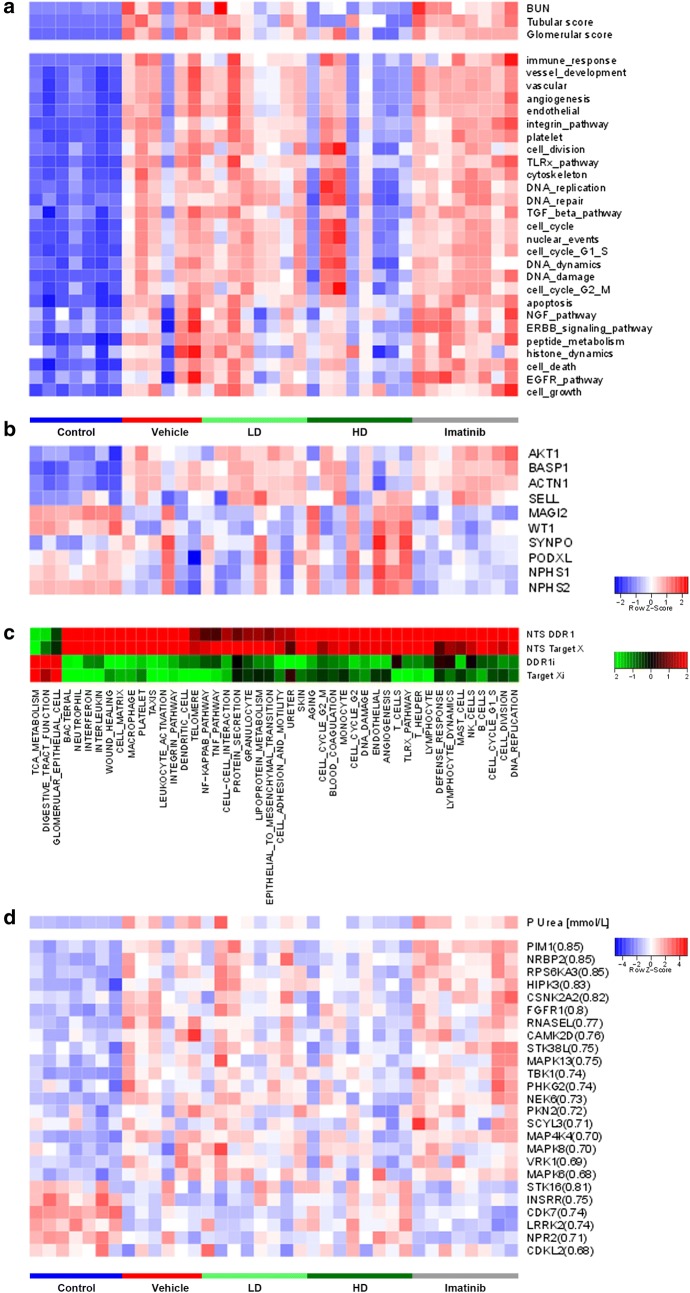
Fig. 5.
Gene expression profile in NTS-treated mice. a Unsupervised gene signature analysis and GSEA using Gene Ontology processes as input genesets. b Glomerular cell signature with individual component genes. c Comparison of different target modulation in NTS. Heatmap showing differential modulation (by DDR1i or Target X) of the gene networks modulated by NTS induction compared to control. d Heatmap showing kinome expression modulation in the different treatment conditions

