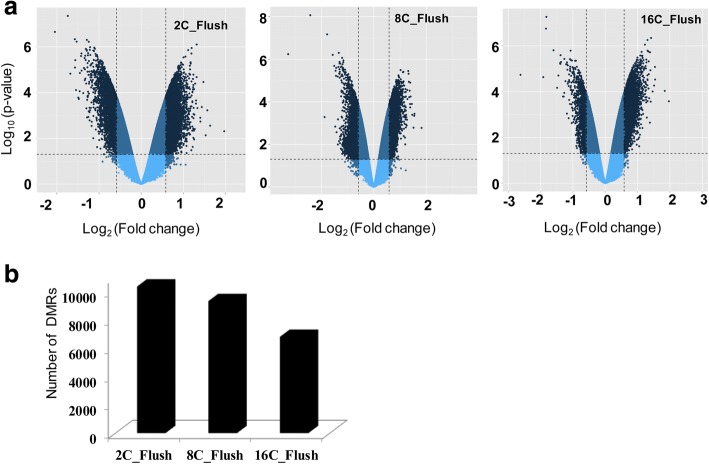
Fig. 2.
Global DNA methylation patterns of differentially methylated genomic regions in different blastocyst groups. a Volcano plots displaying the distribution of hypermethylated (positive log2 fold changes) and hypomethylated (negative log2 fold changes) genomic loci in each blastocysts group. b The total number of differentially methylated genomic regions in each blastocyst group

