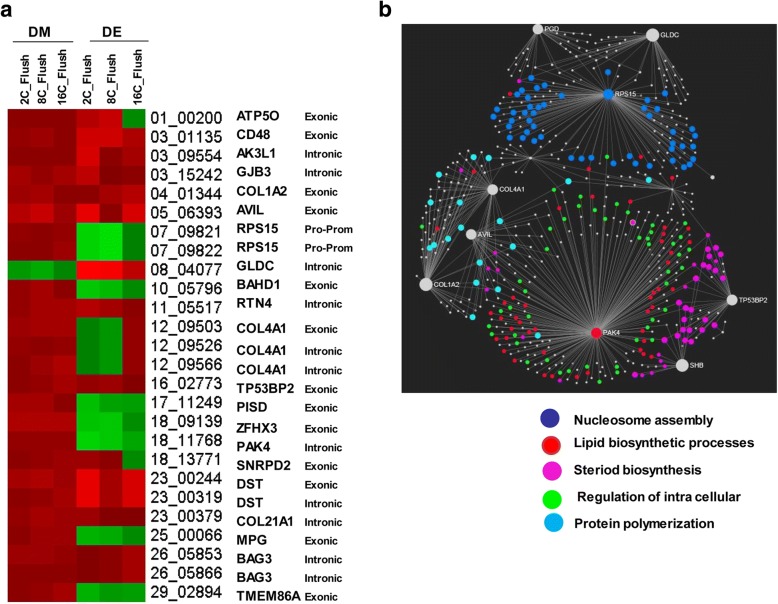
Fig. 5.
a The heatmap depicting the methylation and expression patterns of DMRs commonly detected in all blastocyst groups. DM; differentially methylated, DE; differentially expressed. The red color indicates hypermethylation of the DNA methylation or upregulation of the mRNA expression whereas the green color indicates hypomethylation of the DNA methylation or downregulation of the mRNA expression. b The gene network and biological processes enriched by commonly detected DMRs and which showed inverse correlation with their corresponding mRNA expression levels

