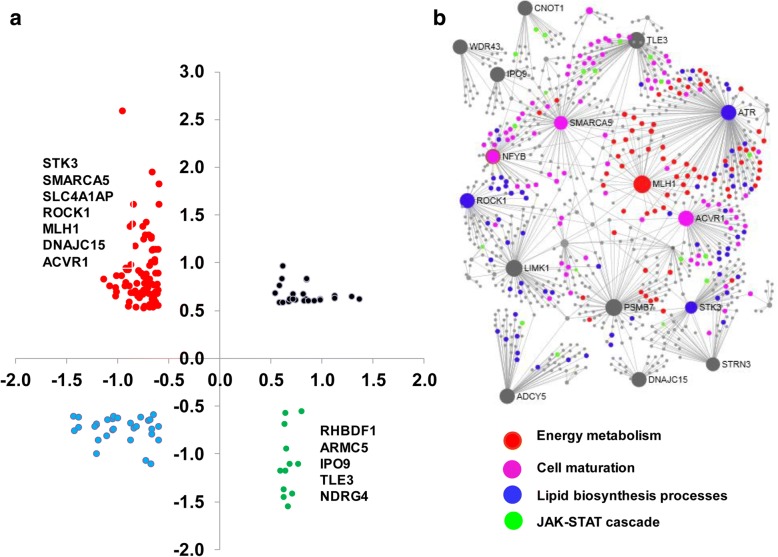
Fig. 7.
a The scatter plot displaying expression patterns and the methylation levels of DMRs commonly detected in the 2C_Flush and 8C_Flush groups in blastocysts of the 2C_Flush. The DNA methylation and mRNA expression levels are indicated in the X and Y axis, respectively. b The gene network and biological processes enriched by these DMRs whose expression levels arenegatively correlated with mRNA expression levels

