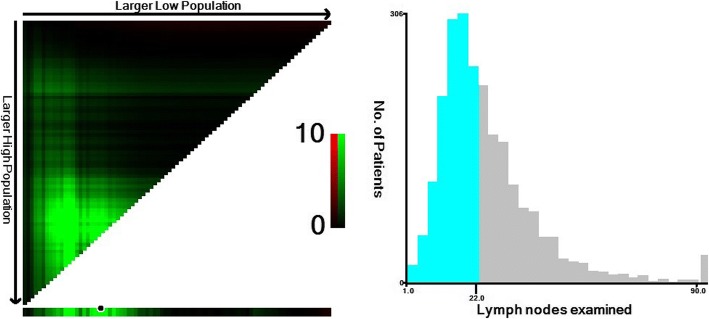
Fig. 1.
Identification of the optimal cut-off point of lymph node count for patients aged < 40. a The distribution of number of young patients according to lymph nodes count. Number of lymph nodes ranged from 0 to 90. b X-tile plots for number of lymph nodes constructed by young patients. The plots show the χ2 log-rank values produced, dividing them into 2 groups by the cut-off point 22. The brightest pixel represents the maximum χ2 log-rank value

