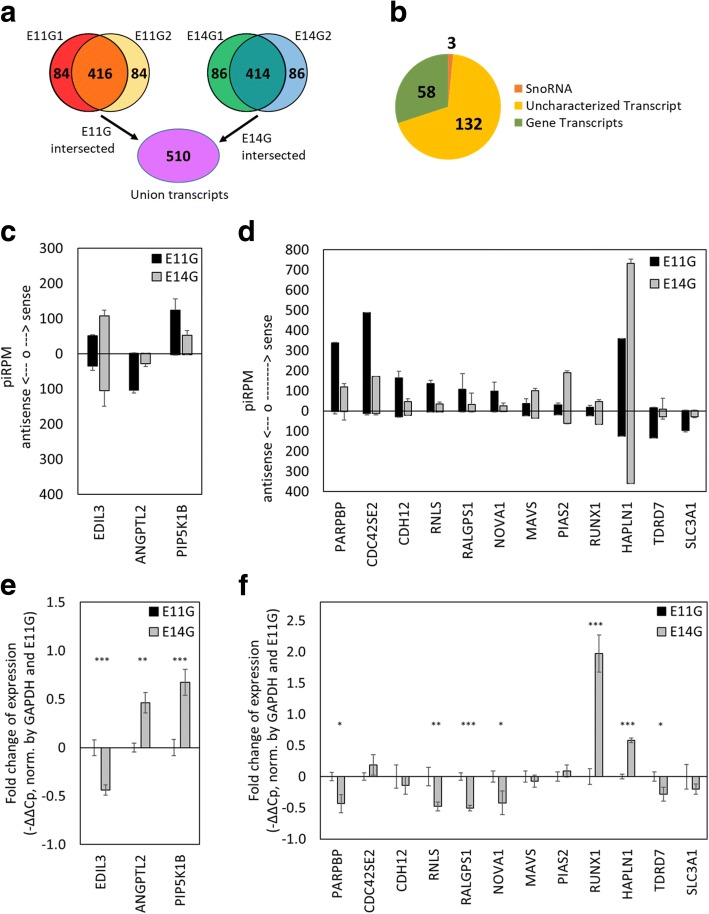
Fig. 3.
Identification of potential piRNA associated genes before (E11G) and after (E14G) spermatogonia formation. a Venn diagram of piRNA-associated target transcripts before and after spermatogonia formation. The top 500 target transcripts were selected from each sample, and the union of reproducible piRNA associated transcripts from E11 and E14 gonads revealed 510 potential piRNA modulated transcripts. b Transcripts with 2-fold difference in normalized piRNA counts are identified, of which 58 are annotated genes. c-d PiRNAs mapped to the sense or antisense of their associated genes. e-f Comparison of relative expression levels of potential piRNA associated genes between enriched germ cells from E11 and E14 gonads (N = 3). *represents p-value < 0.05; **represents p-value < 0.01; ***represents p-value< 0.001. Five genes are reciprocally expressed compared to the amount of associated piRNAs (e), while 12 genes do not have reciprocal relative expression levels to the numbers of piRNAs mapped to them (f)

