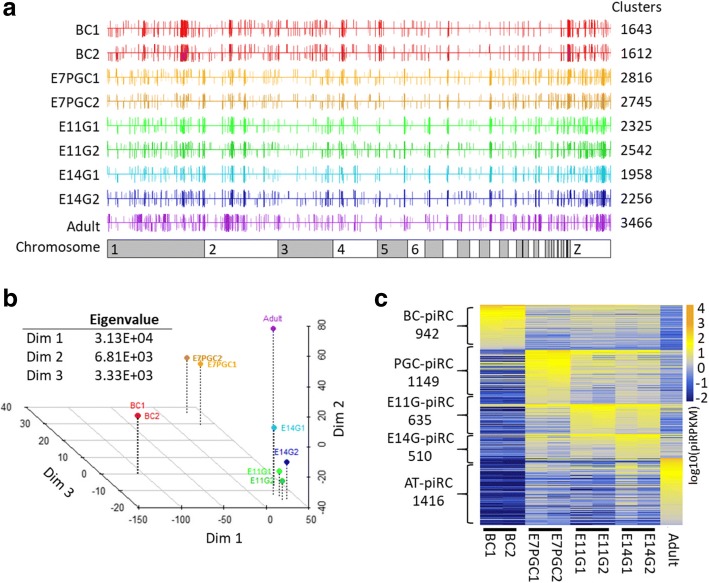
Fig. 4.
PiRNA cluster analysis reveals stage-dependent differential expression of piRNA precursors. a PiRNA cluster locus identified in each sample via proTRAC. Each bar represents a cluster at the plus (up) or minus (down) strand. Length and color depth denote the piRNA density in percentile. b Multidimensional scaling reveals the stage-associated piRNA cluster expression profile. Eigenvalues approximate the degree of variation explained by each dimension. c Identification of stage-enriched piRNA clusters (piRCs), each of which has piRPKM 1.5-fold higher than the second-highest stage. Stage-enriched piRNA clusters from blastodermal cells (BC), primordial germ cells (PGC), embryonic gonads from E11 and E14 (EG), and adult testes (AT) are included

