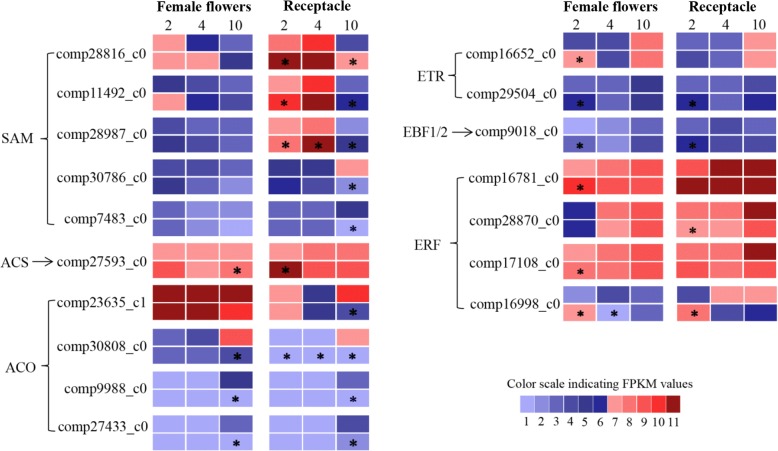
Fig. 6.
Expression patterns of ethylene-biosynthesis and signaling genes. Grids with 11 different colors represent FPKM values 0–10, 10–20, 20–40, 40–60, 60–80, 80–100, 100–200, 200–300, 300–400, 400–500 and over 500, respectively. For each gene, upper and lower rows refer to the results of control and GA3 treatment, respectively. 2, 4 and 10 = days after treatment. *Fold change of FPKM ≥2 and FDR ≤ 0.001

