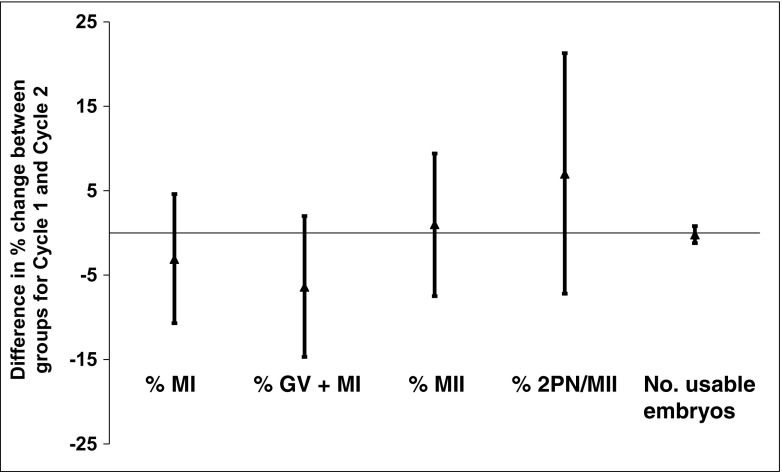
Fig. 1.
Difference in percent change of oocyte maturity and embryo usability from cycle 1 to cycle 2 for the treated compared to untreated groups. Compared to the untreated group, negative values indicate that there was a greater decrease in the given outcome from cycle 1 to cycle 2 in the treated group, while positive values indicate a greater increase from cycle 1 to cycle 2

