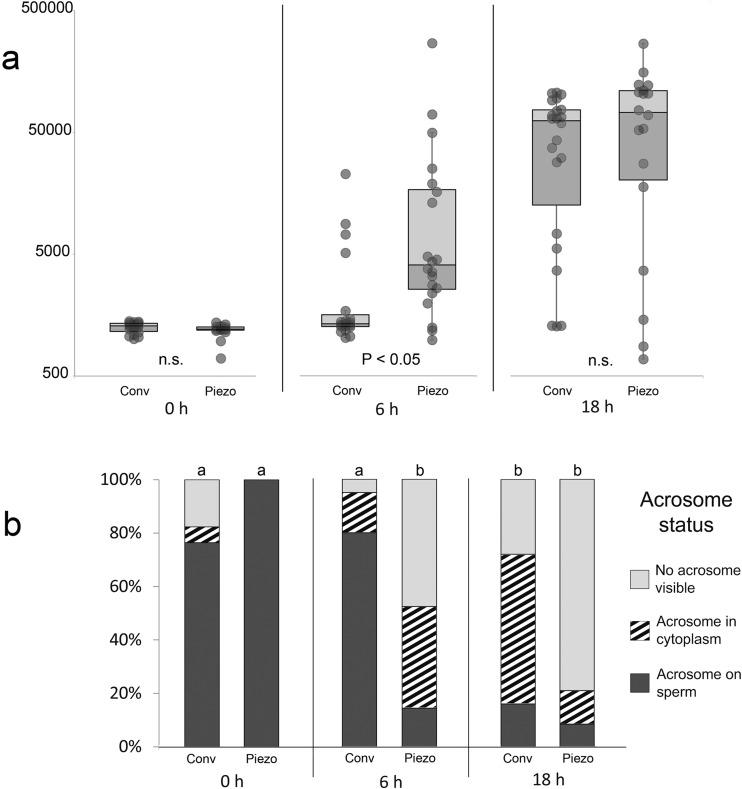
Fig. 3.
a Whisker plot showing median, 1st and 3rd quartile of relative sperm chromatin areas at 0, 6, and 18 h after Conventional or Piezo ICSI. Chromatin area for each sperm is represented as a dot; error bars represent 1.5 × the interquartile range. Note logarithmic scale on Y axis. Values with different superscripts differ significantly (P < 0.05). b Proportion of oocytes showing the different acrosome classifications at 0, 6, and 18 h after Conventional or Piezo ICSI. a,bValues for Acrosome on sperm differ significantly (P < 0.001)

